Infrastructure is a complex and difficult concept for developers. When an issue occurs, where do you even begin to look?
I’ve spent years of my life playing the “What looks like one but not like the other” game, wrestling with confirmation bias and hunting through haystacks of logs to find a clue to my hosted applications. This takes away from time spent improving my applications—and it isn’t fun. “It’s probably the network…” isn’t enough to get the service back up to par. A good SRE needs tools to dive deeper.
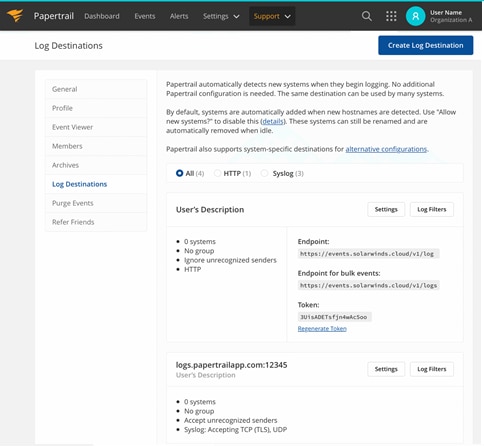
Enter the full stack logging of SolarWinds® Papertrail™. With aggregated logging of applications and systems, it doesn’t matter if you’re investigating one stateful web application or 1,000 stateless containers. Below I’ll outline some of the most common pain points you might face when working with networks, and where you can look to fix them.
5 Common Infrastructure Problems
The five common problems we’ll look at are:
- DNS lookup failures
- SSL certificate failures
- Mysterious connection refused
- Timeouts or intermittent connectivity failures between two applications
- 50x errors across scaled applications
DNS Lookup Failures
Problem
Your brand-new application—or worse—your 12-month-old application that’s been working flawlessly, suddenly can’t connect.
The first place to check is at the application itself. In a custom logging location, stderr, or a more common /var/log/syslog type directory, you might find something like this:
requests.exceptions.ConnectionError:
HTTPConnectionPool(host='example.com', port=80): Max
retries exceeded with url: / (Caused by
NewConnectionError('<urllib3.connection.HTTPConnection
object at 0x7ffb12a9b5f8>: Failed to establish a new
connection: [Errno -2] Name or service not known'))
Traditionally, it can take hours to find how widespread the issue really is. With a centralized Papertrail logging system, you can simply search all logs across a common application to see how far the problem spreads and determine the necessary scope of mitigation.
Mitigation
This error is generally caused by DNS registration failing. Test to ensure your application works when updating your local /etc/hosts (Linux) or C:\WINDOWS\system32\drivers\etc\hosts (Windows) file with a manual configuration of your expected DNS to determine if you can reconnect.
$cat /etc/hosts
...
1.1.1.1 one.com
...
If you find this is all it takes to get your services running again, follow up with your DNS provider to ensure the IP is still bound to the correct DNS record and your registration to your favorite domain hasn’t expired. In the meantime, it could be worth reaching out to your favorite control plane and updating the configurations of the application nodes accordingly.
Slow Hosting Providers
Problem
Your application suddenly becomes sluggish or even entirely unresponsive for no clear reason.
If you have yet to set up a product such as SolarWinds AppOptics™, you may find yourself looking through logs to determine the hangup. The trick is to find the lowest point in the service stack where the problem exists and look at the server or service in the next hop to find the root cause. By perusing the application log in each server for the appropriate application logs in /var/log/syslog, you may come across a log entry like this:
requests.exceptions.ReadTimeout:
HTTPSConnectionPool(host='myapp.example.com', port=443):
Read timed out.
This indicates the myapp server your application is connecting to is the likely culprit. Grab your load balancer’s list of applications and start looking at the direct host for problems like low disk space, low memory, high CPU, or network failures.
A far better use of time is to reach for the application and syslog messages for each downstream system in Papertrail and see if any systems are logging failures related to these system-based errors. Often, an application is likely to respond on its own with “Failed to write to disk,” “OOM Killed,” “Could not create thread,” or a “Connection Exception” of its own.
Mitigation
If you can narrow down the problem to a single host in a pool of hosts, it’s as simple as shutting down the problematic server or removing it from the load balancer. A root cause analysis afterwards may show poor log cleanup, insufficient memory or heap configurations, too many processes, or a problematic network interface. Be sure to note the problem and build your applications to have appropriate timeouts and retry handling to prevent future failures.
If the issue is widespread to all hosts in the service, try deleting log directories and restart applications accordingly to mitigate the impact. If there was a recent change made, then revert the change and watch for the error counts to reduce.
Mysterious Connection Refused
Problem
Your newly developed application that connects to other services and APIs experiences connection issues.
This problem can occur at any layer where the ports are not passing traffic as desired. In your application level logs, like /var/log/syslog, you may see something like the following:
requests.exceptions.ConnectionError:
HTTPConnectionPool(host='localhost', port=8082):
Max retries exceeded with url: / (Caused by
NewConnectionError('<urllib3.connection.HTTPConnection
object at 0x7efc967f05f8>: Failed to establish a new
connection: [Errno 111] Connection refused'))
or
requests.exceptions.ConnectionError: ('Connection
aborted.',
BadStatusLine('\x99\x01\x1a\x96\x01{"translate":"disconnect
.genericReason","with":["Internal Exception:
io.netty.handler.codec.DecoderException:
java.io.IOException: Bad packet id 69"]}'))
These logs indicate the inability to reach the remote service or connect to an incorrect service. It’s worth checking your aggregated logging to validate all servers for your new application are not seeing any connection errors to any other service. This will prevent delays in feature development where time is spent debugging behaviors caused by the downstream application and not the new feature suite.
Mitigation
Validate the configurations of all end-to-end ports. Your firewall should have a port forwarded (8082 in the example provided) to the appropriate destination port of the load balancer. The load balancer should have matching configurations to receive a connection from the outside world to the destination API or application.
Timeouts or Connectivity Failures Between Two Applications
Problem
You’re seeing timeouts and/or connectivity failures between applications.
This is one of the most common issues I see when introducing new regions for an application. Typically, this happens because of issues similar to the ones we’ve already covered above: improper configurations in the new region for port mapping from the external world to the application. Sometimes it’s with firewall aggressiveness. An application may see something similar to the following (the same types of errors as the performance issues).
requests.exceptions.ReadTimeout:
HTTPSConnectionPool(host='myapp.example.com', port=443):
Read timed out.
Papertrail live tailing could find such logs with upstream firewall /var/log/filter.log access blocking by an infrastructure level firewall. This would help to quickly correlate exactly why the service is unable to reach its destination:
Mar 17 10:41:55 pfSense filterlog:
47,16777216,,1000000118,bce0,match,block,in,4,0x0,,128,5408
2,0,DF,6,tcp,
52,192.168.2.10,myapp.example.com,56068,80,0,S,3424458566,,
64240,,mss;nop;wscale;nop;nop;sackOK
Mitigation
Fortunately, this one is easy to solve. Simply log in to the firewall software and permit connectivity to the destination service. This may include a Snort application such as the log above, an IPTables configuration on the host, or a filter on the load balancer. Without centralized logging, it would be almost impossible to find such a blocker in a reasonable time.
50x Errors Across Scaled Applications
Problem
You’re getting 50x errors and you have no idea why.
This is one of the hardest problems to solve, even with just one server in the mix. 50x errors can occur anytime, anywhere, and are often vague. And with highly available architectures and cross-platform providers, nailing down problems with any one service becomes even more difficult.
To identify the problem, the easiest method is to look at a live tail and find the 50x error returning to the client. Then, look for the logs occurring around the same time in your holistic view of the infrastructure. This will give you an idea of potential sources. These may be across many logs depending on the complexity of your application, but an example might look like:
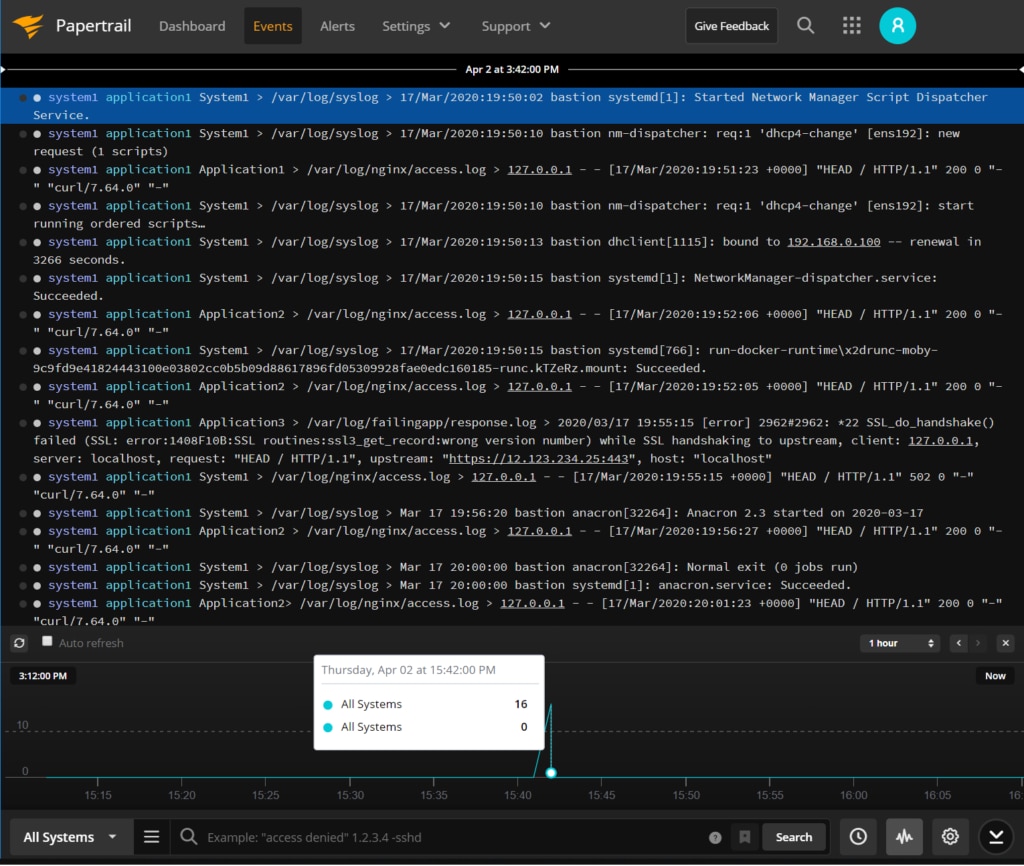
We can conclude from the log above that System1 is returning a 502 to the client, and its upstream server failed with an SSL issue.
Mitigation
In this case, we’re attempting a web call to 12.123.234.25 on port 443, and the application is returning a “Wrong Version Number” on the “SSL_do_handshake()” method. We don’t see the same errors on Application2 or Application1, indicating this is a localized problem with just one server. To mitigate, this could be as simple as removing Application3 from the nginx configurations until we better understand the issue.
Conclusion
Troubleshooting application issues, even on a single server, is hard enough to require a dedicated engineer’s hours or even days to understand, identify, and fix. Configuring your infrastructure to centralize logs across the whole infrastructure and application stack simplifies the process greatly and can get developers back to their core job: building product.