Node.js was introduced over 20 years ago and remains a popular choice for web application teams with over 30 million users. Sites such as Netflix, PayPal, and Uber continue to rely on Node.js to build and maintain their applications.
There are many reasons DevOps teams continue to embrace node.js
- Easy to learn
- High performance
- Scalability
- Extensibility
- Full stack
- Microservices support
- Integrations and support for open-source
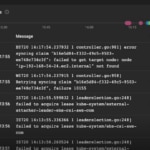
Even if you are an experienced developer and know the ins and outs of Node.js, you can still experience unexpected performance issues, such as a memory leak or long-running processes blocking the Node.js event loop. Continuously monitoring key Node.js performance metrics can alert you to emerging issues and enable optimal performance and resiliency for your Node.js application.
Metrics to Measure
Choosing the right Node.js performance metrics to monitor depends on your specific application and its goals. In the ideal scenario, you select and prioritize metrics to reflect your desired application outcomes and user experience. With the right selection of metrics, you can
- Identify performance bottlenecks
- Predict and prevent issues
- Optimize resource allocation
- Inform decision making
Node.js metrics are frequently broken down between front-end metrics and back-end metrics. To get a holistic view of application performance, it is important to measure and monitor both. Front-end metrics typically monitor usability issues and focus on improving the application’s user experience. Back-end metrics reveal server-side problems and highlight where you can improve your code.
The best practice is to identify metrics across both the front and the back end. You and your team know your application, so you are in the best position to select metrics to provide the deepest performance insights. Here are some metrics other teams have used to monitor the health of their Node.js application.
Front End Metrics
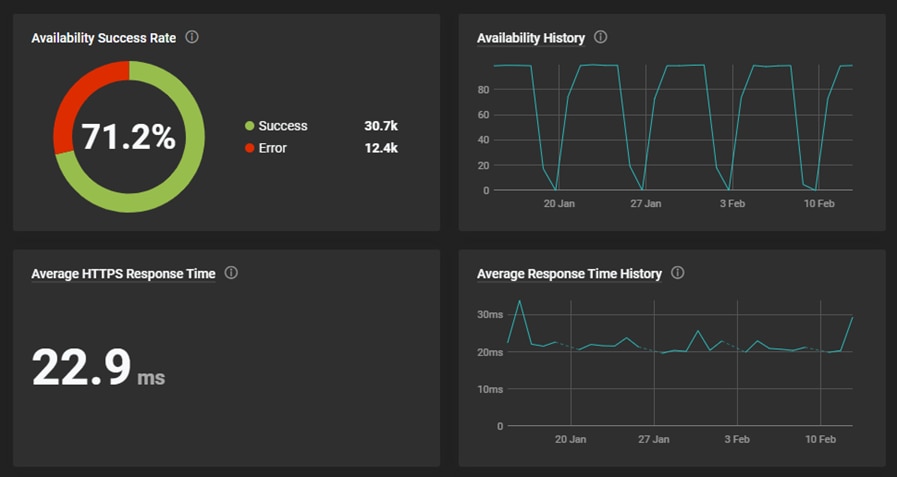
- Uptime – Measures the percentage of time your application is available and functioning correctly. High availability is essential for a good user experience and a predictor of future reliability.
- HTTP Throughput – Measures the number of requests per second (RPS) or data transferred per second. It’s an important metric for evaluating how well your application scales. It focuses on overall processing, calculating how much work your application can complete in a given timeframe.
- Response Time – Measures the time it takes for the application to process a request and return a response. This metric is a key component of both overall application health and the APDEX score, which measures user experience. In addition to monitoring average response time, it is also important to monitor peak response time. Identifying slow requests and requests that exceed a 3x threshold can be a way to spot both opportunities for performance optimization and memory leaks.
- HTTP Concurrency – Measures the number of concurrent requests your application can efficiently handle. It indicated how well your application manages parallel requests without a performance impact.
Back End Metrics
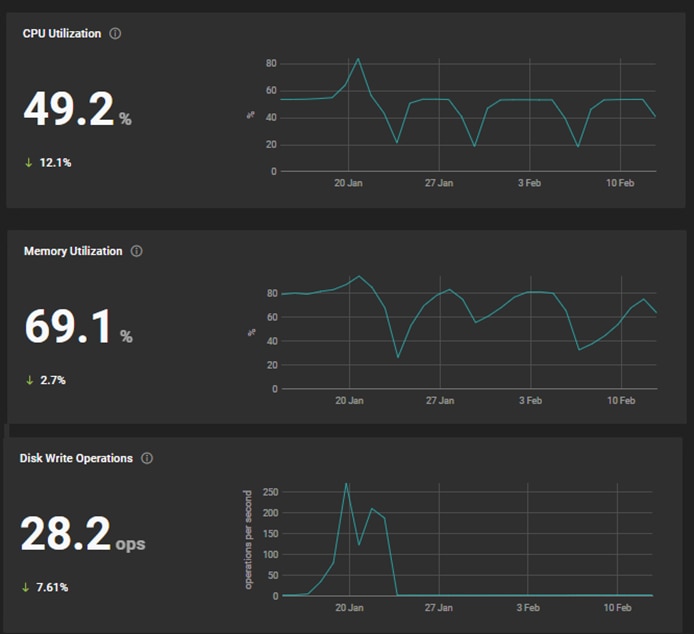
- CPU Usage – Measures the percentage of CPU resource consumed by your application. Monitoring CPU usage helps you identify overloaded services and inefficient code sections. For example, if you identify requests that consume more than 50% of CPU, you may need more CPU capacity, or you may need to revise the section of code causing a CPU spike.
- Memory Usage – Measures the amount of memory your application occupies. Monitoring memory usage helps you identify potential memory leaks and avoid crashes.
- Network Activity – Measures the incoming and outgoing network traffic created by your application. Keeping an eye on changes in network activity can help identify network-related issues impacting your application.
- Event Loop Latency – Measures the time it takes for the event loop to process a new event. High latency can have a direct impact on responsiveness and throughput.
Other Metrics to Consider
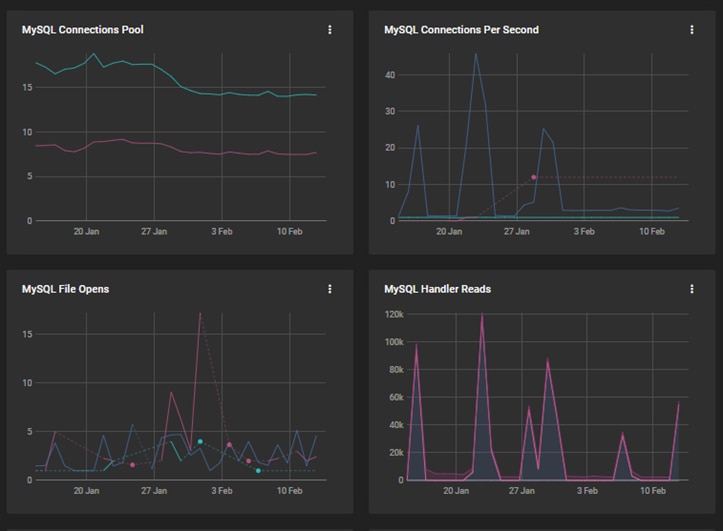
- Database Performance– Metrics such as query times, active connections, connection errors, transaction per second, lock, and deadlocks are essential for Node.js applications that rely heavily on databases. Closely monitoring database performance helps identify bottlenecks, cost-optimize database resource allocations, and ensure database stability.
- Error Rates – Tracking the number, type, and location of errors occurring within your application can help identify problems early on. Monitoring error rates after new feature deployment can provide insights into release stability.
- Custom Metrics– Capturing metrics specific to your application’s functionalities and workflows can be helpful for evaluating health and performance.
Note to Developers
When building Node.js applications, it is essential to keep an eye on event loop latency. Reducing event loop latency is the best way to measure improvements in application performance. If, on the other hand, you see the event loop latency increase, you may need to evaluate code design or do a code walk-through with your team.
As you build your code, you want to avoid a blocked event loop. A blocked event causes increases in response time for other requests and results in sluggish application performance or worse. Since the event loop runs on a single thread, any long-running synchronous task can block this thread. General guidelines suggest avoiding high CPU-intensive operations, sync file operations, and blocking network calls, for example.
Why Metrics Monitoring Matters
A holistic approach to measuring and monitoring Node.js metrics spanning front end, back end, database, network, and user experience provides the inputs you can use to design and deliver a responsive, resilient, and scalable application. Actively measuring, monitoring, and analyzing metrics offers potential benefits for the DevOps team and the overall business.
Using metrics, you can optimize application performance.
- Identify bottlenecks: Tracking metrics across the application layers enables you to pinpoint performance bottlenecks and resource constraints across the entire stack. This allows you to prioritize optimization efforts and achieve better overall performance.
- Troubleshoot proactively: Identifying performance issues early allows you to correct them and prevent any user impact. You can fix problems before they cause downtime or slowdowns, ensuring a smooth user experience.
- Allocate resources efficiently: Analyzing resource utilization data (CPU, memory, network) helps you allocate resources efficiently and avoid overprovisioning or under-provisioning, reducing costs and optimizing infrastructure usage.
You can analyze metrics to improve application stability and reliability.
- Early detection of errors: Proactive monitoring helps you detect errors and exceptions in both front-end and back-end components before they lead to crashes or disruptions. This enables quicker response and resolution, improving application stability.
- Enhanced debugging: When issues arise, full-stack metrics provide valuable context to understand the root cause of problems. Correlating data across different layers helps pinpoint the origin of errors and streamline debugging processes.
Measuring and monitoring metrics empowers you to focus on delivering business value and enhancing the user experience.
- Cost optimization: Proactive monitoring helps prevent performance issues that could lead to increased business costs, including downtime, lost users, support tickets, etc. Additionally, optimizing resource allocation based on usage data can reduce infrastructure expenses.
- Informed decision-making: Data-driven insights from metrics enable you to make informed decisions about application scaling, infrastructure investments, and future development efforts, aligning technology with business goals.
- Better user experience: Ensuring optimal performance and stability allows you to provide a consistent and positive user experience, which can improve user engagement and satisfaction.
More than monitoring – Observability
SolarWinds Observability SaaS connects performance data from Node.js applications to their services, hosts, databases, networks, and end-user experience for a holistic view of performance. With end-to-end visibility across all aspects of Node.js performance, you can analyze performance trends, identify hotspots, and make data-driven decisions. If you’d like to see what observability can do in your environment, sign up for a free 30-day trial today.