Last updated: October 10, 2025
Containerization has simplified the life of the developer. It allowed developers to offload the setup of the necessary runtimes, libraries, and servers. For small projects, this was all that developers needed. However, managing multiple containers for larger and more complex applications became difficult. Kubernetes emerged to address this problem, simplifying complex deployments through the use of orchestration.
Although Kubernetes is an excellent tool, it also introduces new challenges, such as memory usage issues. In this post, we’ll explore how to utilize logging efficiently, enabling you to identify and avoid common problems with misconfigured resource allocation in Kubernetes.
Why Kubernetes Is Great for Developers
Put simply, Kubernetes lets developers worry about fewer things. It helps developers to:
- Make sure that all their containers are running.
- Reschedule containers if any node becomes saturated.
- Manage the deployment of new container versions with rolling updates.
As a developer using Kubernetes, you no longer need to worry about doing any of that. You can focus on the application itself. You can also instruct Kubernetes on how it should manage and distribute resources. This is a handy feature since, usually, different parts of your application (different containers) have different resource needs.
Scalability and Flexibility
Kubernetes brings another significant advantage to developers: scalability. With Kubernetes, it doesn’t matter if your application has a handful of containers or if it has hundreds of them. Kubernetes can manage clusters of five servers and those with 500 servers—with equal efficiency. A single Kubernetes cluster can comprise multiple pools of machines located in different regions.
Built-In Load Balancing
As a developer, sometimes you need to implement extra logic in the code to make distributed applications bulletproof. Again, the larger the application (i.e., the more containers it consists of), the more effort you must invest in that extra coding.
However, Kubernetes can also help in this regard. It has built-in load-balancing features. Not only can it automatically perform load balancing of requests between a specified set of containers, but it can also bypass containers that can’t handle any more load or are not functioning correctly.
What is Kubernetes Logging?
Kubernetes logging refers to capturing and managing logs generated by applications and services within a Kubernetes cluster. SolarWinds Papertrail provides several efficient mechanisms for collecting and storing log data. It provides developers with flexibility in selecting and configuring various logging options, enabling them to customize log management according to their specific needs.
For example, if you want to collect logs from the standard Docker streams, you can use Logspout (a lightweight log router), or you can collect all the logs within a cluster using Fluentd. Moreover, you can also configure centralized logging using remote_syslog2.
Managing Resource Usage
The abstraction layer created by Kubernetes and its features are beneficial, but they also complicate troubleshooting—especially when it comes to resource management and allocation. Kubernetes is designed for distributing containers across multiple nodes in the most effective way possible. But to do it well, it needs your help.
Kubernetes allows you to specify the amount of resources a container requires to function correctly, as well as how much is too much. You do this by setting resource requests and resource limits.
- Resource requests: A guaranteed amount of resources reserved for the container. If more CPU or RAM is available on the host, a container can utilize more resources than specified in its requests.
- Resource limits: The maximum amount of resources that the container is allowed to use. If a container attempts to allocate more resources than its limits allow, Kubernetes will throttle it down or terminate it.
Setting these numbers is optional, but doing so is a best practice.
Identifying and Avoiding Common Resource Management Misconfigurations
While it may not sound like rocket science to set requests and limits, misconfiguring them can result in negative consequences. Let’s consider the most common problems.
Memory usage and allocation
How does Kubernetes assign memory for a container? It depends. A pod can be run in one of the following scenarios:
- No resource requests or resource limits set (default).
- Only resource requests are set.
- Only resource limits are set.
- Both resource requests and limits are set.
No requests or limits set
Without requests and limits set, pods will be managed on a first-come, first-served basis. Kubernetes will attempt to distribute RAM equally among all running pods. However, if one pod attempts to allocate more and more memory, Kubernetes may kick out other pods from the node to meet the demand. There is nothing stopping pods from consuming all the free memory on the node. Take note: this is not a situation in which you want to have a memory leak.
Setting only requests or only limits
You might be thinking, “I’ll set resource requests to guarantee the amount that my pod needs to run properly, but I don’t think I need limits.” Doing this will solve some problems.
By setting resource requests, Kubernetes ensures that a particular pod is scheduled on a node with a minimum amount of RAM available. So, in theory, you’re safe. But in practice, there is still nothing that protects you from a memory-leaking application.
That means if you have a pod that needs only 512 MB of RAM to run correctly on a node with 8 GB of RAM, and you respectively set the memory request to 600 MB for that pod, then you should be able to fit more than 10 pods on that node. But if one of these pods has a memory leak, Kubernetes may not schedule any other pod on that node.
On the other hand, if you only set limits, there is no guarantee of a minimum amount of RAM for the pod. Therefore, depending on the system’s usage, your application may not perform correctly.
Troubleshooting Memory-Related Errors
Setting both memory resource requests and limits for a pod helps Kubernetes manage RAM usage more efficiently. But, of course, doing so won’t necessarily solve all your problems.
OOMKilled: Container limit reached
Suppose an application has a memory leak or, for any other reason, attempts to use more memory than a set limit. In that case, Kubernetes will terminate it with an OOMKilled - Container limit reached event and exit code 137.
So, whenever you see such a message, you either have to increase the limit for the pod if the memory usage was expected (perhaps simply due to an increased load on the website) or debug the application if the usage was sudden and unexpected. You also need to keep in mind that Kubernetes killing a pod like that is a good thing—it prevents all the other pods from running on the same node.
OOMKilled: Limit Overcommit
Kubernetes uses memory requests to determine which node to schedule the pod on. For example, on a node with 8 GB of free RAM, Kubernetes might schedule 10 pods with 800 MB of memory requests, or five pods with 1.6 GB of memory requests, or one pod with 8 GB of memory requests, and so on. However, limits can (and should) be higher than requests and are not taken into account for scheduling.
For example, you can schedule ten pods on the same node with 800 MB for memory requests and a 1 GB memory limit. This leads to a situation where some pods may attempt to utilize memory that exceeds the node’s total capacity of 8 GB.
In this case, Kubernetes may terminate some pods, as explained above. A key point to understand here is how Kubernetes determines which pod to terminate. This is the hierarchy Kubernetes uses to decide which pods to delete:
- Terminate BestEffort pods first. These have no resource requests or limits, so they get no guarantees.
- Terminate Burstable pods next. These have requests set, but if they exceed their requested resources, they may be evicted.
- Terminate Guaranteed pods last. These have equal requests and limits for all containers, giving them the highest level of protection.
This hierarchy is why it’s recommended to set appropriate values of both requests and limits for each workflow.
CPU Requests/Limits
Setting CPU requests and limits isn’t as straightforward as memory, where you can simply define a specific number of bytes. Kubernetes defines CPU resources as “CPU units.” They equal one vCPU/core for cloud providers and one hyperthread on bare-metal machines. In theory, a CPU request of “1” will allow a container to use one vCPU/core (regardless of whether it’s running on a single-core or 24-core machine). Fractional values are also possible, so a value of “0.5” will allow a container to use half of the core.
Under the hood, Kubernetes translates these values into a proportion of CPU cycles that is allocated. This means that, in the case of high CPU usage on the node, there is no guarantee that the container will get as much CPU as it requested. So, it’s a matter of prioritization.
For this reason, unlike with memory limits, Kubernetes will not terminate a container that attempts to use more CPU than its allocated limit. Instead, Kubernetes will only throttle down the process, assigning it less CPU time. Since CPU requests/limits are not absolute value settings but the percentage of the quota, troubleshooting CPU performance-related issues can be challenging.
Monitoring to the Rescue
If resource requests and limits are set to incorrect values, this can cause more harm than good. Unfortunately, it’s not easy to guess which values are the correct values in the first place. You should have at least a general idea of the resources your application requires. Then, your best bet is to start from reasonably guessed numbers and gradually adjust them to the optimal values.
You can use Kubernetes Vertical Pod Autoscaler (VPA) to automatically adjust requests and resource limits for containers running in pods in a deployment. VPA can improve resource utilization by automatically setting requests based on usage, maintaining proportions between limits and requests, and scaling up pods that request insufficient resources over time.
VPA can also help you by monitoring CPU and memory usage and assisting you in defining these values in your deployment. However, due to the complexity of Kubernetes, your best bet is to have a monitoring system (and if you think you don’t need one, read this blog post).
Aggregating and monitoring logs can help determine suitable values for requests and limits. Most events related to requests and limits are logged. Issues associated with Kubernetes memory usage, such as OOMKilled - Container limit reached, are relatively straightforward to troubleshoot.
You can read more about troubleshooting with Kubernetes logging here. Fortunately, it’s easy to stream all the logs from Kubernetes into a single location. Tools like FluentD can handle that very well. From there, you only need a system that can aggregate and display the most important messages directly.
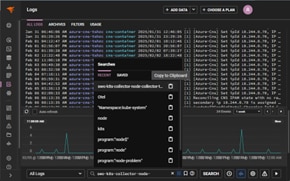
SolarWinds Papertrail can simplify searching and managing Kubernetes log data.
SolarWinds Papertrail can manage logs not only from containers but also from Kubernetes components and nodes, providing an even better overview of what’s happening in your cluster. It’s convenient, especially when used with larger clusters.
The powerful yet simple search syntax offered by SolarWinds Papertrail can dramatically reduce debugging time. Moreover, it can show you events with context and pinpoint issues. Do you prefer real-time troubleshooting? SolarWinds Papertrail has you covered with its Live Tail feature.
When you’re ready to see it yourself, sign up for a free trial or request a demo today..