SolarWinds® Observability now brings more intelligence to issue identification to help you troubleshoot smarter and faster. When an entity alert is triggered, Log Patterns automates an AIOps / ML-based analysis of events surrounding the triggering event.
Using Log Patterns, you can skip the hours spent manually scrolling through event messages looking for unusual or significant patterns. You can harness the power of AIOps and ML-derived intelligence to highlight significant event patterns and bring focus to event patterns related to the alert, simplifying and accelerating troubleshooting.
Log Patterns analyzes events contributing to an alert
The Log Pattern dashboard presents a holistic view of the contextually related event patterns preceding the alert. Armed with this intelligence, you can quickly understand the complex relationships contributing to the triggering event.
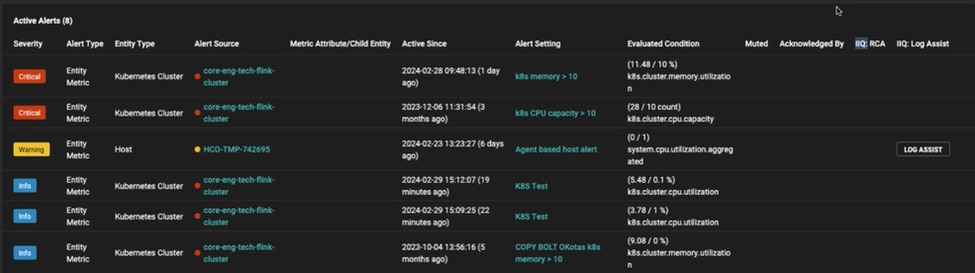
Accessible from the Active Alerts screen, Log Patterns generates an interactive view of log patterns after an alert is triggered. Log Patterns looks back an hour to analyze the events that preceded the triggering event. It filters out normal or informational event messages to identify unusual and meaningful event messages and then uses intelligence to identify patterns.
When you select Log Patterns next to an alert, you will see a summarized view of the meaningful log patterns detected.
Interactive Log patterns report
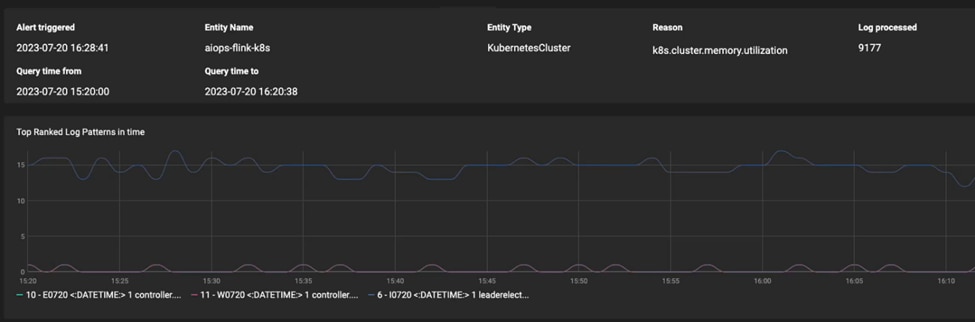
The log patterns summary at the top displays the time the alert was triggered and the time period covered by log pattern analysis, the name of the entity, the suspected cause of the triggering event, and the number of logs processed.
Below, you will see a graph of the top-ranked log patterns. You can use the log patterns graph to:
- Explore one or multiple event patterns by selecting the log pattern ID in the legend
- See volume changes of different log patterns over time
- Visualize interactions between multiple log patterns
AIOps/ ML ranked logs patterns
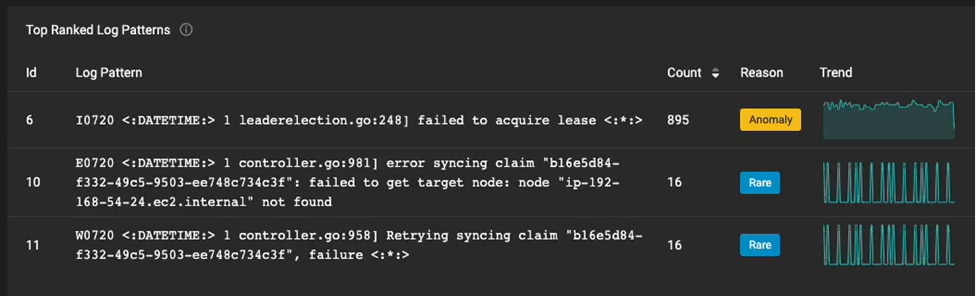
- Ranking – Log patterns are ranked from the most to least likely to be related to the alert using an AI Ops/ ML-based analysis of the event messages.
- Count – Log patterns count the number of occurrences of each of the log patterns detected within the time period. You can use the count as a way to sort the log patterns displayed in the list.
- Reason – Log patterns indicate the reason the event pattern was flagged and the pattern’s frequency. A single occurrence of an event pattern during the time period is tagged ‘unique,’ while infrequent repetitions are tagged ‘rare,’ and an unusual number of an event pattern is tagged as ‘anomaly.’
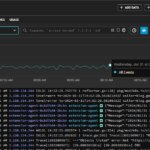
Timeline View
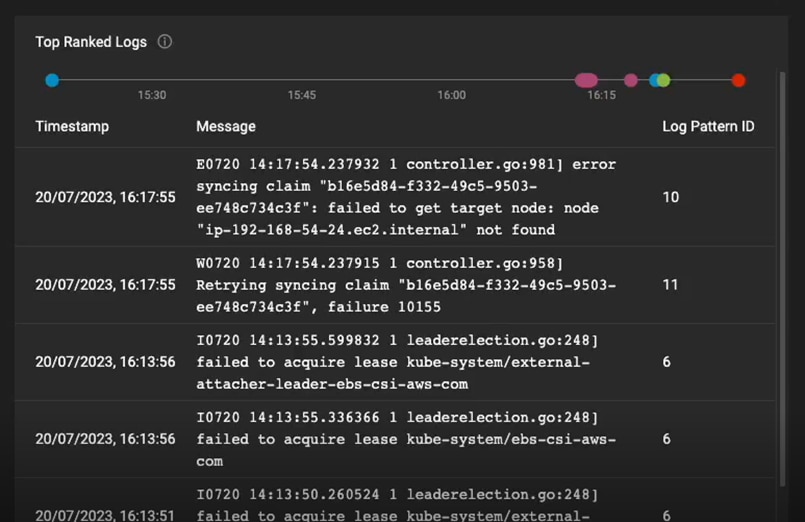
The timeline view plots the log patterns detected in a sequential timeline. The blue dots frame the time span of events processed by the log pattern analysis. The red dot indicates the last alert messages, with other dots representing the log patterns detected.
The timeline view is useful for events arising from conditions that degrade over time as well as understanding cascading alerts arising from a singular cause.
Try Log Patterns for yourself
If you are already a SolarWinds Observability SaaS user and you’d like to see how Log Patterns can simplify troubleshooting alerts in your environment just let us know.
If you are not using SolarWinds Observability SaaS Logging, you can experience the power of full stack observability in our interactive demo environment or by starting a free trial of SolarWinds Observability SaaS.