Last updated: August 2024
There are many methods to help you avoid bugs in your application. You can use linters, write tests, or use an IDE, which will help you spot bugs early in the coding phase. However, no matter how good you are at preventing bugs, they will always happen. And it may not have anything to do with you. You could get hit by a bug in the third-party library you use. Therefore, as important as bug prevention is, it’s also crucial to know the debugging process well.
In this post, you’ll learn how to debug Ruby on Rails applications.
Importance of Debugging Ruby on Rails Applications
Debugging is an essential part of the software development lifecycle, and Ruby on Rails applications are no exception. Identifying and fixing bugs promptly not only improves the user experience but also ensures the stability and reliability of your application. Here are some reasons why debugging Ruby on Rails applications is crucial:
- Enhanced Application Reliability: Debugging helps identify and resolve issues that could potentially lead to application crashes or unexpected behavior. By addressing these issues proactively, you can improve the reliability of your Ruby on Rails application.
- Improved User Experience: Bugs and errors can frustrate users and drive them away from your application. By debugging your Ruby on Rails application regularly, you can ensure a smooth and seamless user experience, leading to higher user satisfaction and retention.
- Faster Time to Resolution: Effective debugging practices help developers identify and fix issues more quickly. This reduces the time spent troubleshooting and allows you to deliver updates and new features to your application faster.
- Cost Savings: Identifying and fixing bugs early in the development process is more cost-effective than addressing them after the application has been deployed. Debugging helps prevent costly downtime, lost revenue, and damage to your reputation.
Now, let’s explore some effective debugging methods and tools for Ruby on Rails applications:
The Debug Method
Let’s start with the most straightforward option: Rails’ own debug method. It can be used for displaying data for any object in the front end. This is helpful when something isn’t showing properly on a website, and you want to find out if it’s missing in the database or it’s an issue with the view code.
You can place it anywhere in a view, and it’ll generate human-readable information about the object. For example, if you don’t see the user’s name on the website, you can add debug @user to the view code to display all users’ data in the view.
<%= debug @user %>
<h2>User name:</h2>
<%= @user.name %>
This code will produce something like this:
--- !ruby/object:User
concise_attributes:
- !ruby/object:ActiveModel::Attribute::FromDatabase
  name: name
  value_before_type_cast: ExampleUser1
- !ruby/object:ActiveModel::Attribute::FromDatabase
  name: email
  value_before_type_cast: example@email.com
- !ruby/object:ActiveModel::Attribute::FromDatabase
  name: type
  value_before_type_cast: standard_user
In the case where you don’t see the user’s name, debug @user lets you check to see if the user’s name is being properly retrieved from the database. If there’s no error there but you still don’t see the user’s name on the website, then the issue could be in the view code.
The debug method can replace a common practice of using puts to print variables’ values to Ruby’s console. It’s quicker and easier to add one line with debug to the view code than finding the appropriate controller and searching where to add puts to it.
Web-Console Gem
Another popular option for debugging a Ruby on Rails application is web-console.As the name suggests, web-console allows you to create an interactive Ruby console session directly in your web browser. This is extremely useful for live debugging. What’s great about web-console is that by default, it’s not visible on the website; therefore, it won’t disturb your development. It’s activated only when there’s an actual error. So, whenever your Rails application crashes, besides the actual error, you’ll see the interactive console where you can quickly learn what happened. You can install web-console like any other gem by adding it to your gemfile:
group :development do
  gem 'web-console'
end
And then execute bundle install.
It’s important to note here, web-console allows you to execute any code on your server. Therefore, you need to make sure access to the console is restricted. You definitely shouldn’t use it in production environments. In other environments, depending on if they’re publicly accessible, you may want to also restrict access by specifying allowed IP addresses (or subnets). You can do this by setting the following config entry for the environment:
config.web_console.permissions = '10.10.10.0/24'Rails Logger
Rails Logger is another built-in tool for debugging Ruby on Rails applications. It allows you to log information, warnings, and errors, making it easier to track the flow of your application and identify issues.
# Logging an information message
Rails.logger.info('This is an information message')# Logging a warning message
Rails.logger.warn('This is a warning message')# Logging an error message
Rails.logger.error('This is an error message')Logs
Next on our list are logs. In development mode, when something goes wrong, Rails displays an error detail page. This page provides a backtrace and highlights the problem areas. This is usually enough to figure out which line of code in which file needs to be fixed. However, sometimes the error details page may be misleading.
For more complex issues or for those that don’t make the application crash, you need to rely on logs. Logs can help you better understand what led up to the problem. Logs are also crucial in a production environment where you can’t use other debugging methods (for example, the previously mentioned web-console). And logs can help you find issues before they cause problems. For example, you can see deprecation warnings in logs:
W, [2021-04-11T08:42:41.893826 #1]  WARN -- : DEPRECATION WARNING: Single arity template handlers are deprecated. Template handlers must
now accept two parameters, the view object and the source for the view object.
This is something that’s not a problem currently but will become one when you try to upgrade your Ruby on Rails application.
Byebug Gem
Yet another popular debugging tool for Ruby on Rails applications is the byebug gem. The typical debugging process looks like this:
- Application crashes
- Read the error message, and find which piece of code caused it
- Fix the bug in the code
- Restart the application to check if the issue is gone
- Repeat the process if the issue isn’t resolved
Usually, it takes more than one round of the above process. Byebug gem helps you simplify it into one action. With byebug,you can set breakpoints to the application, so when the error happens, you can perform debugging directly on the running application.
Ruby on Rails Console
Rails’ own console, IRB, is a bit of an underrated debugging tool. It’s commonly used for actions like adding new components to the application, (re)starting the server, or running database migrations. However, it can also be used for debugging purposes.
With the console active, you can execute Ruby code against the running application. This means, instead of “static” debugging like printing the variables, you can directly interact with the server to check whatever you need. IRB console also has a useful dry-run option. You can execute any query to see what it will do without actually saving the change. You can do this by passing the—sandbox parameter to your command. Since the IRB console comes with Rails itself, it’s always available, which makes it easy to start.
However, IRB is basic and has some limitations. If you want something more feature-rich, you can use a pry console instead. It’s an open-source alternative to the IRB console with additional many added features like syntax highlighting, history, the ability to install plugins, and more.
Next-Level Debugging
All of the debugging methods and tools mentioned above are helpful and relatively easy to implement. They’re definitely useful in development environments or for easy issues. For production workloads and complex problems, however, these tools won’t be enough.
Debugging Production Environments
On live systems with real users, you need to rely mainly on logs. But it doesn’t mean the debugging will be more difficult. In fact, if you use a tool like SolarWinds® Papertrail®, debugging can get even easier. Logging is a double-edged sword. On one hand, you can find everything in logs—not only the actual error but also entries telling you exactly what led to the problem. On the other hand, however, if your logs aren’t centralized, you’ll end up looking for log and manually scanning through hundreds of irrelevant unsorted messages, which will slow the debugging process.
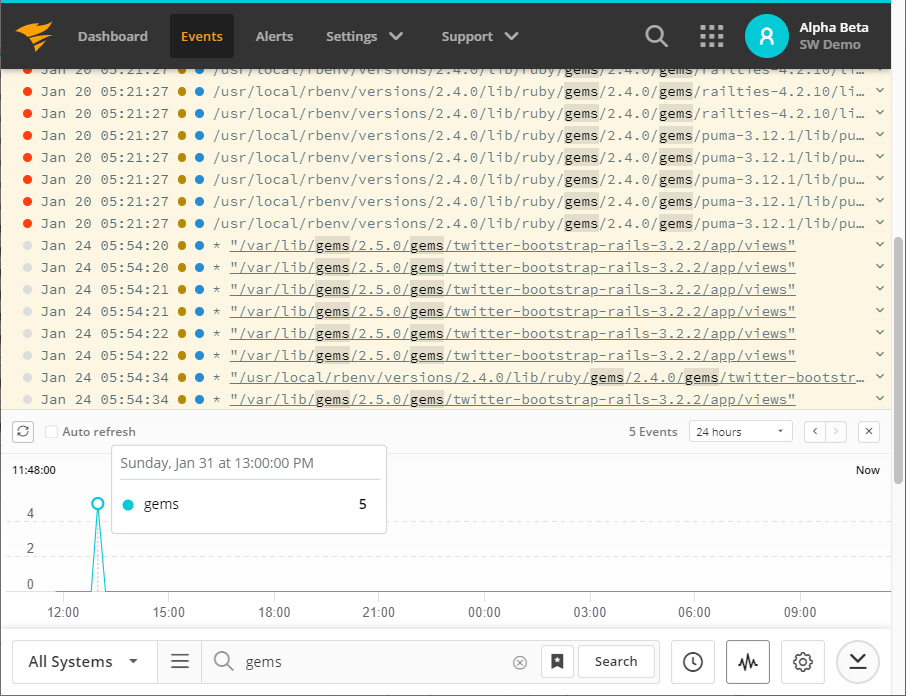
Papertrail can automatically aggregate logs from many different tools and systems (including Ruby on Rails) and lets you search across all your log files from single search bar. This means you can simply ship your logs to Papertrail and when there’s an issue, you can quickly find the relevant events and shorten the troubleshooting process.
Logging on Steroids
But that’s not the only benefit. Papertrail allows you to get alerts instantly when errors are detected. You can also search thousands of log entries in seconds or follow real-time tail logs.
Another benefit of using a log management solution like Papertrail is the fact that you aren’t limited to Ruby on Rails. Some issues you experience in your application can have a root cause somewhere else: an overloaded host machine, network issues, or even full storage. With Papertrail, you can monitor your entire infrastructure in one place and avoid downtime.

Summary
As you can see, there are many ways to debug your Ruby on Rails application. Many of the built-in methods are helpful in the development phase, but for production environments, you need more. A feature-rich log management system that can monitor not only your Ruby on Rails application but the whole infrastructure is what you need. Debugging alone isn’t the goal. Avoiding downtime is. With Papertrail, you can get notified when issues start, so in many cases, you’ll have time to fix the problem before there’s a service interruption .
This post was written by Dawid Ziolkowski. Dawid has 10 years of experience as a Network/System Engineer at the beginning, DevOps in between, Cloud Native Engineer recently. He’s worked for an IT outsourcing company, a research institute, telco, a hosting company, and a consultancy company, so he’s gathered a lot of knowledge from different perspectives. Nowadays he’s helping companies move to cloud and/or redesign their infrastructure for a more Cloud Native approach.
Still searching? You may be interested in the SolarWinds troubleshoot diagnose outages