Cloud platforms like Render have made developers’ lives easier by handling many of the underlying infrastructure concerns. You can deploy web services, spin up databases, and schedule cron jobs without ever setting up a server manually. However, this convenience comes with a challenge: Accessing logs across these disparate services takes time and effort.
To overcome this challenge, many developers centralize their logs with a log management service. Centralizing your logs is essential for effective troubleshooting and performance optimization. Without it, you risk missing critical issues or spending unnecessary time collating logs from various services.
In this walkthrough, we’ll guide you through setting up live log monitoring for your Render services using SolarWinds® Papertrail™. We’ll show you how to configure a Papertrail log destination, point your Render log streams to it, and monitor log activity in real time.
Let’s get started!
Build our application
To keep this demonstration simple, we’ve built a basic API server with Node.js and Express. Our API server will interact with a PostgreSQL database featuring a single table called users. Our API server handles the following requests:
- A GET request to /database will return JSON with an array of names and email addresses for users in our database table.
- A POST request to /database will insert a new user (using a randomly generated name and email address) into our database table.
- A DELETE request to /database will delete a user from our database table.
- A GET request to / will return the number of user records in our database table.
Render connects seamlessly with GitLab and GitHub. When Render detects a new commit has been pushed to the master branch, it rebuilds and redeploys your updated application.
We’ve created a GitHub repository for our project, which we’ll connect to Render in a later step. Working in our empty project folder, we’ll begin by initializing a Node.js project:
~/render-api-server$ yarn init --yes |
Next, we’ll add the packages we’ll use for our project:
~/render-api-server$ yarn add express pg faker@5.5.3 |
We’ll start by writing all of our database-related functions. We open a new file in our project root folder called db.js. The file looks like this:
const faker = require('faker') |
That’s all there is to our Node.js application. Now, we’re ready to set up our services on Render.
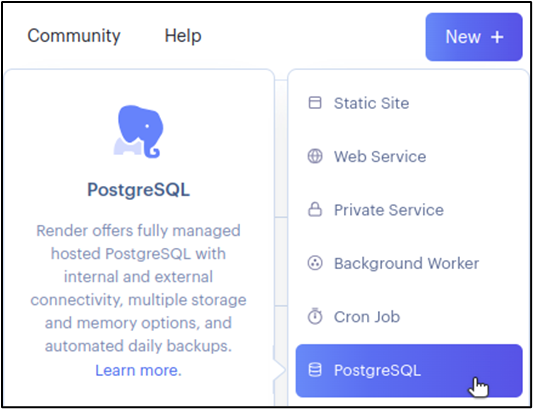
Set up Render services
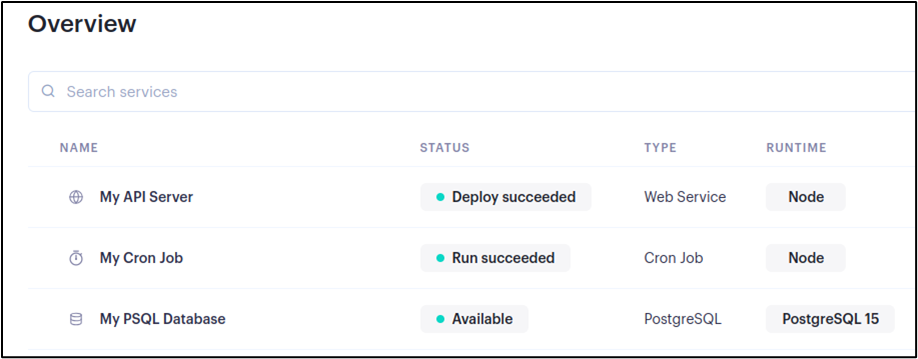
In Render, we will spin up the following:
- A web service for our Node.js Express API server
- A PostgreSQL database
- A cron job that will send a GET request to our server’s / endpoint every minute
Each of these services will emit log statements. After we’re all set up, we’ll configure a Render Log Stream to centralize all of our services’ logs to Papertrail.
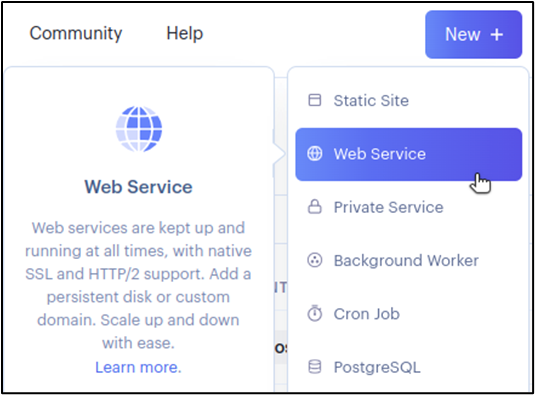
Create a web service for our Node.js application
On Render, we create a new web service and connect it to our GitHub repository for our Node.js project.
Create a PostgreSQL instance
Next, we create a new PostgreSQL service.
Add users table to PostgreSQL database
With our PostgreSQL service up, we’ll need to add our users table to our database. We navigate to the Info page of our database, and we copy the PSQL Command.

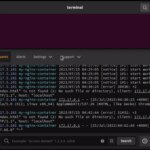
In a terminal window, we use the command we copied to connect to our database. Within the psql client, we add the extension for UUID support, and then we create our table:
psql=> create extension if not exists "uuid-ossp"; |
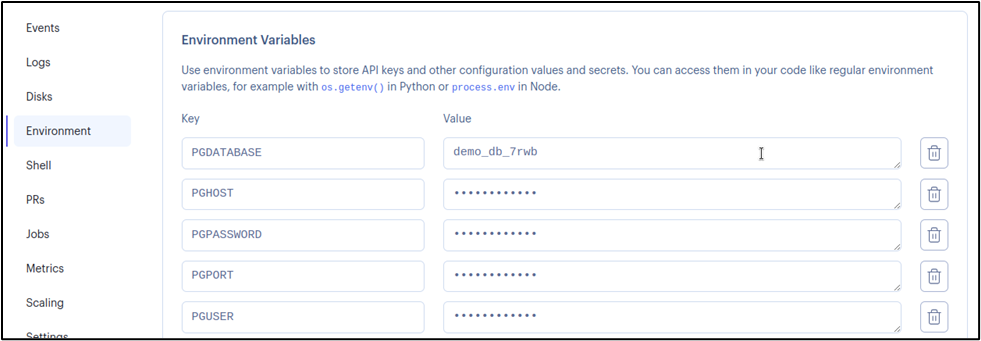
Set database credentials as environment variables for web service
Our Node.js application uses the pg package to set up a client designed to query our database. This package expects environment variables with database credentials. We can find all the information we need for our database on the Info page. On the Environment page for our web service, we added the following environment variables:
PGDATABASE: name of databasePGHOST: internal or external host name (either is OK since our database is hosted by Render, too)PGPASSWORD: password for accessing the databasePGUSER:username for accessing the databasePGPORT:port on which the database accepts connections (5432).
Now, our database is ready for interaction from our Node.js application.
Create a Render cron job
Finally, we want to set up a Render cron job to run every minute. For our cron job, we’ll create another GitHub repository and another Node.js application, but our application will be incredibly simple. We add the node-fetch package at version 2 (yarn add node-fetch@2). Then, we have a single file called index.js, with the following contents:
const fetch = require('node-fetch'); |
Our application is simple: send a request to a specific web address and then log the result of the request.
To create the cron job in Render, we connect our new GitHub repository. Then, we set the schedule for our job to run every minute.
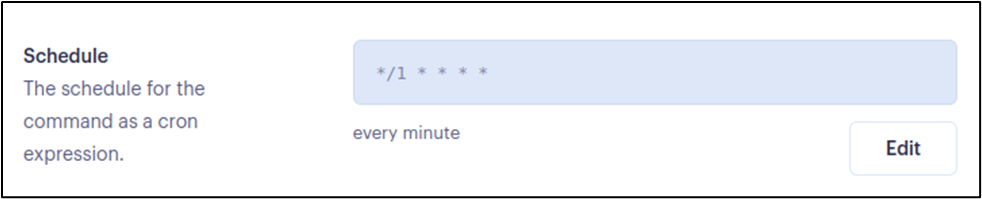
The command for our cron job is node index.js.
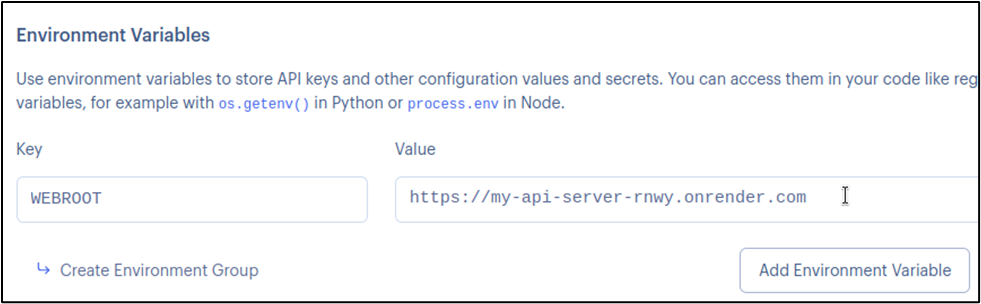
Last of all, our cron job needs an environment variable called WEBROOT. The value of this environment variable will be the web address of our API server. To find the address, we go to our web service and look at the top of the page for the externally available web address:
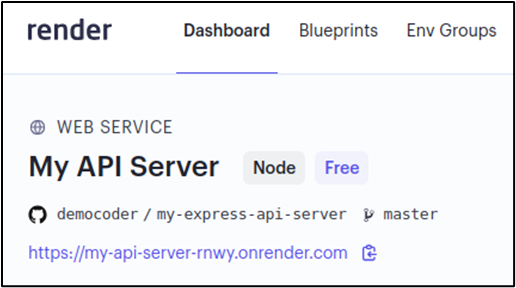
We copy the web address and set it as the value of WEBROOT for our cron job environment variables.
We’ve successfully set up our Render web service, PostgreSQL database, and cron job!
Next, it’s time to prepare Papertrail to receive logs.
Set up a Papertrail log destination
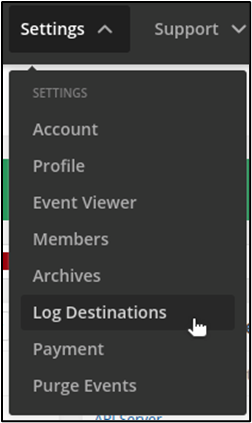
If you don’t have a Papertrail account, you can sign up for one (it’s free!). After logging in, navigate to Settings -˃ Log Destinations.
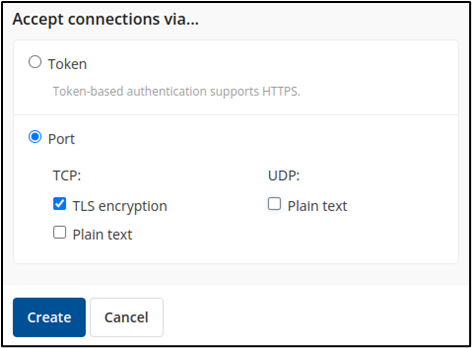
On the Log Destinations page, click on Create Log Destination. Provide a short description of your new log destination. Then, under Accept connections via… choose a Port connection with TLS encryption.
When you’ve finished creating your log destination, Papertrail will give you a unique URL endpoint where you can send your logs.
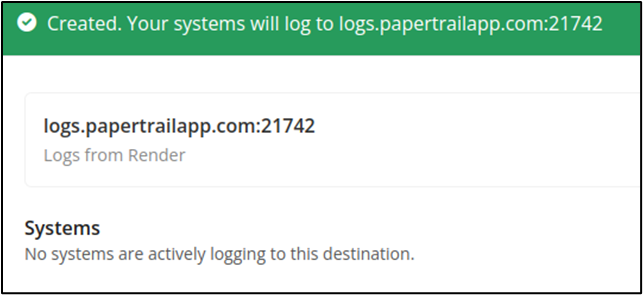
Copy down that endpoint address.
Configure Render log streams
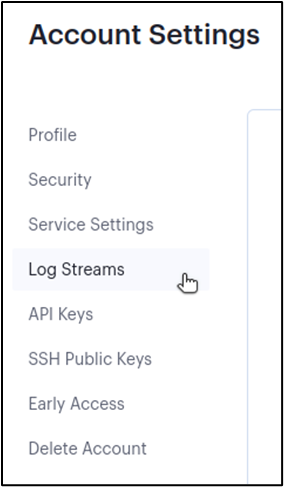
For our final step, we’ll head back to Render to set up a log stream that points to our Papertrail endpoint. We navigate to our Account Settings page, and then to Log Streams.
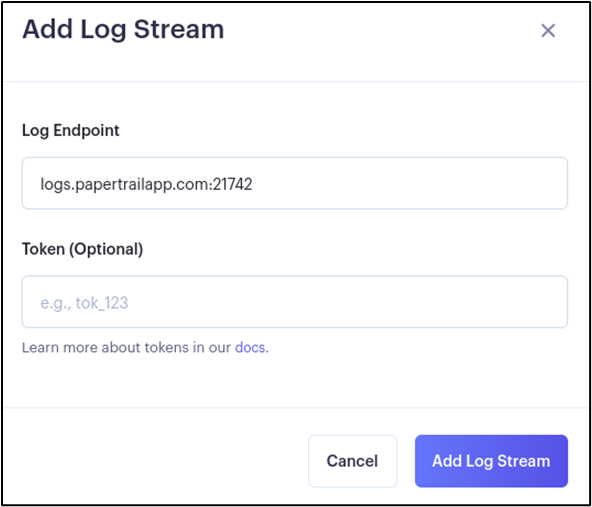
On the Log Streams page, we click Add Log Stream. For our new log stream, we paste in our Papertrail log destination endpoint. We don’t need to provide a token for this endpoint.
After successfully adding our log stream, any log messages from our Node.js application, PostgreSQL database, or cron job will make their way to Papertrail.
Live Monitoring of Render services in Papertrail
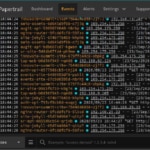
Returning to Papertrail, we navigate to the Events page, and we see real-time log activity from our Render services streaming in.
As we send curl requests to our API server, we see our application logs show up in Papertrail within a few seconds, alongside logs from our cron job and our database.

It works! We have successfully implemented live monitoring of logs from our Render services in Papertrail.
Advanced options
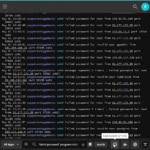
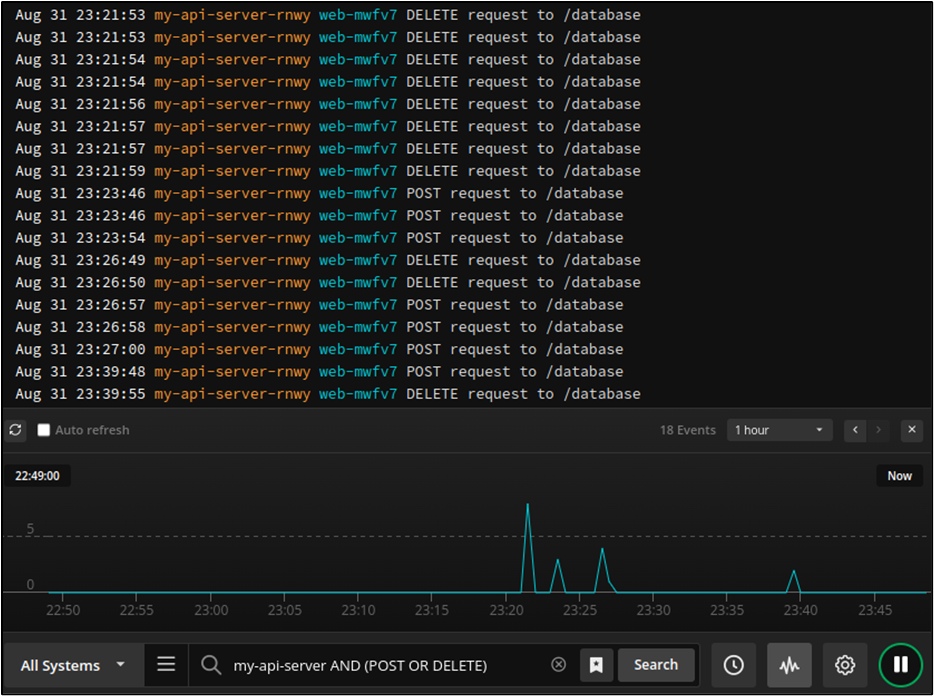
You might notice the database logs are quite noisy. If we only want to view log events from our API server and cron job, we can enter search criteria (my-cron-job OR my-api-server) to trim down what we see.
Live monitoring with Papertrail offers many features that you can take advantage of. You can seek a specific date and time to examine what happened in your log history. You can view a velocity graph of incoming log events based on search criteria.
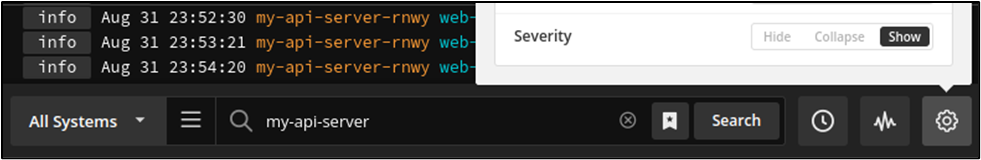
If you use log levels in your application logging (which is a best practice, by the way), then you can display and search by severity level as well.
You can also save your searches for future reuse.
Finally, you can set up alerts for Papertrail to notify you if incoming log messages match specific search criteria or surpass a given threshold. The alert capabilities in Papertrail can integrate with services like Slack, Amazon SNS, or PagerDuty, as well as use generic webhooks or email.
Conclusion
Render is a convenient, low-cost cloud platform provider. Developers can quickly and easily spin up web applications, databases, Redis instances, and more. They can also schedule background workers or cron jobs. While this is convenient, developers need to access and see logs from all of these services in a single place. Otherwise, troubleshooting issues or optimizing performance will be cumbersome and time-consuming.
The solution to managing logs from these disparate services is log centralization. In this walkthrough, we’ve shown how to send logs from our Render services to Papertrail. With Papertrail, you’ll see all of your logs in one place, streaming in real time. With all your logs in Papertrail, you can take advantage of advanced querying and automated alerts.
When you’re ready to get started with Papertrail, you can sign up for a free account or contact us today!