TLDR Summary: Docker’s built-in logging works for individual containers but doesn’t scale for distributed systems, so the post shows how using Docker’s Syslog logging driver to send container logs to Papertrail enables centralized aggregation, live tailing, and fast search across many containers. This approach gives teams real-time visibility and alerting for Docker-based applications without complex setup.
Docker’s power and versatility have cemented its place in developers’ and administrators’ toolkits. Along with this widespread adoption comes the critical need for effective logging in Docker containers. However, once you scale beyond a single container on a single machine, effectively capturing and working with logs from Docker presents a challenge. The native docker logs command quickly becomes inadequate, and you’ll need a more scalable solution.
In this article, we’ll address this challenge by using the Docker Syslog logging driver to export and aggregate your container logs to Papertrail™ for continuous live monitoring. Let’s first dive into Docker logging basics to build a strong foundation for what’s to come.
Docker Logging Basics
Every Docker container generates logs as it runs, providing a chronological account of events and interactions that occur within the container. These logs are essential for debugging purposes and performance analysis. You can access these logs simply by using the docker logs command followed by the name or ID of the container.
Start up an example Docker container
As an example, we have a Docker container that runs a simple Nginx server. The Nginx configuration file (default.conf) looks like this:
server { |
The Dockerfile for our container looks like this:
FROM nginx:alpine |
When we run our container, we immediately see our Docker container logs:
$ docker build --tag nginx . [+] Building 1.3s (8/8) FINISHED … |
However, if you start a Docker container in daemon mode (running in the background), you won’t automatically see the logs as you would when running a container interactively.
$ docker run --name my-nginx-server -p 80:80 --detach nginx |
With the process detached, you will only see the container ID, but none of the container’s logs will be displayed.
Output all logs for a detached, running container
The docker logs command will output all the logs for the container. If you add the --follow (or -f) option, you can see all the previous logs and tail the logs, allowing you to monitor its ongoing activity.
$ docker logs --follow 84ffc16 |
Notice that the docker logs command can take the container ID or the container name if you assign a name to the container.
$ docker logs --follow my-nginx-server |
Limit the amount of output to a specified number of lines
To control the amount of output, you can use the --tail option, which allows you to limit the output to a specific number of lines. For example:
$ docker logs --tail 5 my-nginx-server |
Filter the logs to fit within a specified timeframe
The --since and --until options are useful for filtering logs based on a specific timeframe. These arguments expect a timestamp formatted as YYYY-MM-DDTHH:MMZ. For example, if we want to see all logs since a certain time, we would do the following:
$ docker logs --since 2023-07-24T23:42Z my-nginx-server |
Or perhaps we want to see any logs until a certain point in time:
$ docker logs --until 2023-07-24T23:42Z my-nginx-server |
Understanding these basics of Docker logging is the first step in effectively managing and monitoring your Docker logs.
Exploring the Docker Syslog Driver
Docker provides several logging drivers, each designed to send container logs to a different place. For example, the default json-file driver writes logs formatted as JSON. The Docker Syslog logging driver sends logs to a Syslog daemon running on the container’s host or on a remote server.
Within the context of exporting Docker container logs, the Syslog logging driver proves particularly useful. The logs sent to the Syslog daemon can be further processed downstream and forwarded to other systems for storage and analysis. Therefore, the Syslog logging driver is an ideal solution when aggregating logs from multiple containers to a single location.
If you want to send your container’s logs to the local syslog, you simply need to set --log-driver=syslog:
$ docker run The SolarWinds, SolarWinds & Design, Orion, and THWACK trademarks are the exclusive property of SolarWinds Worldwide, LLC or its affiliates, are registered with the U.S. Patent and Trademark Office, and may be registered or pending registration in other countries. All other SolarWinds trademarks, service marks, and logos may be common law marks or are registered or pending registration. All other trademarks mentioned herein are used for identification purposes only and are trademarks of (and may be registered trademarks of) their respective companies. |
A quick check of our local Syslog shows our container logs showing up there.
$ tail -n 5 /var/log/syslogJul 24 20:31:21 demo 9d88a8b65260[1671]: 2023/07/25 03:31:21 [notice] 1#1: start worker process 34 |
Now that we’re getting comfortable with the Syslog logging driver, let’s explore how to send our container logs to a remote Syslog daemon for centralized log management and live monitoring.
Sending Logs to Papertrail with the Syslog Logging Driver
Papertrail is a cloud-based log management service used by organizations to aggregate logs across their entire tech stack—applications, services, devices, and more. With its live monitoring capabilities, fast search, and webhooks, Papertrail enables engineering teams to analyze and troubleshoot incidents with efficiency.
For distributed applications—such as containerized microservices running on different host machines—log aggregation to the Papertrail Syslog server is an excellent solution that is simple to implement.
Get your Papertrail Syslog server address
Sign up for a free Papertrail account to get started with this solution.
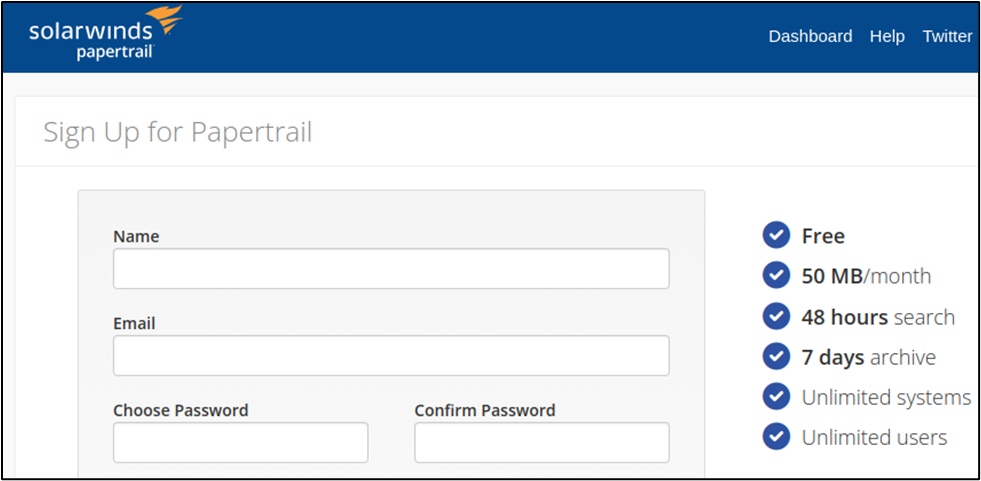
After logging in, navigate to your Dashboard and then click Add Systems.
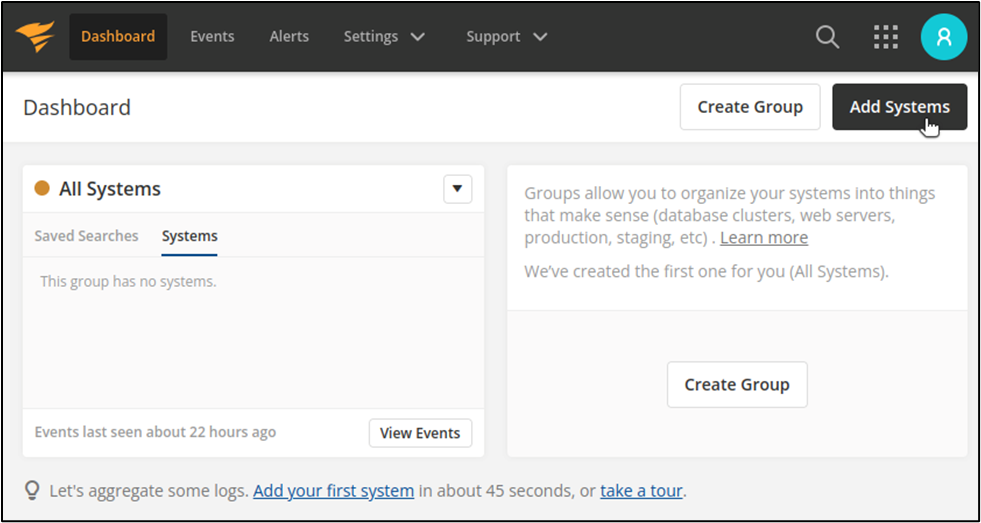
At the top of the system setup page, you’ll see a message that looks similar to this:

Your URL will be unique, but it is the one you will use as your remote Syslog server address. Copy it down.
Run Docker container with Syslog address specified
In our example Docker container, we simply need to add a --log-opt option, setting our syslog-address to use UDP and reference the URL and port that points to Papertail. We start up our container like this:
$ docker run \ |
Notice that we provide an additional --log-opt option, tagging our logs for this container with my-nginx-container.
Verify logs appear on Events page
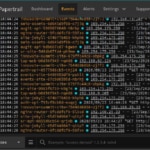
Next, we navigate to the Events page at Papertrail. This is what we see:

Our logs are arriving, and you can see that they are tagged with my-nginx-container. Imagine if you are aggregating logs from multiple containers to Papertrail. By tagging each one (for example, with my-nginx-container or authentication-api or payment-processing-service), then you’ll have all your logs in one place but can still take advantage of filtering (by tag) to narrow down your view to a specific container.
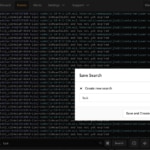
Live monitoring of Docker Logs in Papertrail
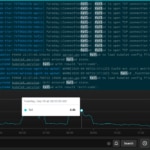
One of the best features of Papertrail is its ability to live tail your incoming logs. With this feature, we have continuous monitoring of our Docker logs. As activity happens in your Docker containers, you see the log events propagate to Papertrail almost immediately.
In a sense, the live tailing in Papertrail is similar to the output you would get by using docker logs --follow. However, consider how cumbersome it would be to use docker logs --follow for every one of your Docker containers, across all the host machines on which they run. With Papertrail, you get the best of both worlds: log aggregation to a centralized location and live tailing.
Couple this with the alerts in Papertrail—which can send you notifications through Slack, PagerDuty, or other means whenever incoming logs meet certain search criteria—and efficient search and analysis capabilities, and you have a robust solution for managing your Docker logs that is quick to implement and easy to use.
Conclusion
As software organizations increasingly pursue the building of distributed microservice-based applications, you’re likely depending on Docker more and more for your containerized microservices. With this comes a need to be adept at working with Docker logs.
Following the log for a single Docker container is trivial. However, distributed applications often comprise dozens (or even hundreds) of containers. For this, you need aggregation to a centralized log management platform like Papertrail. Fortunately, with Docker’s Syslog logging driver, shipping your container logs to Papertrail is simple and straightforward. From there, you can take advantage of live tailing, blazing-fast search, and alerts. You’ll be all set for continuous monitoring of your Docker container logs, ready to respond to and handle any incidents that come your way.
When you’re ready to get started with Papertrail, sign up for a free account or contact us to see a demo of Papertrail in action.