It’s important to ensure the logging and monitoring of a service is as consistent across environments as the code itself. However, it can be expensive and cumbersome to test the logging functionality with the usual required log exporters, database infrastructure, and processing requirements of normal production-grade solutions.
And even if you don’t have the desire for consistency through the entire product life cycle, it’s still difficult to manually search through logs to troubleshoot issues.
Together with SolarWinds® Papertrail™, SolarWinds rKubeLog™—an open-source project—does this work for us. rKubelog fetches logs from all the services running in the cluster, tags them, and forwards them directly to Papertrail.
Manual Debugging Process
Manually interacting with your application on a single local system may not seem daunting or even worth the time to export the logs, but this presumed simplicity can be deceiving. Debugging development environments can prove to be quite a challenge, requiring specialized knowledge to truly ferret out the behavior of a local system. In addition, when you’re testing a system with localized Kubernetes clusters, the task is exponentially more difficult, as there’s a high number of services requiring a detailed understanding of the inner machinations.
For example, let’s say we have an intermittent return of “HTTP/1.1 403 Forbidden” in one of our deployments with 10 pods in a service. How might we identify this issue with only the normal tools at our disposal?
First, let’s look at our setup below. We have one deployment of 10 pods, which is exposed on a service with a port 80 and an external IP of 192.168.6.4 in a microk8s cluster with metallb.
ubuntu@microk8s-vm:~$ sudo microk8s kubectl get service,ep,pods -l app=nginxdep
NAME               TYPE           CLUSTER-IP       EXTERNAL-IP   PORT(S)        AGE
service/nginxdep   LoadBalancer   10.152.183.206   192.168.6.4   80:30836/TCP   7m34s
NAME                 ENDPOINTS                                               AGE
endpoints/nginxdep   10.1.23.19:80,10.1.23.20:80,10.1.23.21:80 + 7 more...   7m34s
NAME                            READY   STATUS    RESTARTS   AGE
pod/nginxdep-5f85bd7fb4-7plpl   1/1     Running   0          7m50s
pod/nginxdep-5f85bd7fb4-9wv4v   1/1     Running   0          7m50s
pod/nginxdep-5f85bd7fb4-bjxr6   1/1     Running   0          8m11s
pod/nginxdep-5f85bd7fb4-g75fc   1/1     Running   0          7m50s
pod/nginxdep-5f85bd7fb4-hg7xp   1/1     Running   0          7m50s
pod/nginxdep-5f85bd7fb4-j9lnv   1/1     Running   0          7m50s
pod/nginxdep-5f85bd7fb4-k9cjc   1/1     Running   0          7m50s
pod/nginxdep-5f85bd7fb4-tzwzc   1/1     Running   0          7m50s
pod/nginxdep-5f85bd7fb4-xcrzv   1/1     Running   0          7m50s
pod/nginxdep-5f85bd7fb4-zwhv9   1/1     Running   0          7m50s
This seems to be fine, but it’s been sitting around a bit and we may have been playing with some of these pods to test different functions. Now it’s after lunch, and I’m pretty sure this is a clean deployment. Let’s just run a few tests to make sure.
ubuntu@microk8s-vm:~$ curl -I http://192.168.6.4
HTTP/1.1 200 OK
Server: nginx/1.19.2
Date: Mon, 21 Sep 2020 00:35:23 GMT
Content-Type: text/html
Content-Length: 612
Last-Modified: Tue, 11 Aug 2020 14:50:35 GMT
Connection: keep-alive
ETag: "5f32b03b-264"
Accept-Ranges: bytes
ubuntu@microk8s-vm:~$ curl -I http://192.168.6.4
HTTP/1.1 403 Forbidden
Server: nginx/1.19.2
Date: Mon, 21 Sep 2020 00:35:24 GMT
Content-Type: text/html
Content-Length: 153
Connection: keep-alive
Well that’s not right—two different results from our replica-set? That’s not much of a replica at all.
Where’s Waldo?
Let’s see if we can find which pod is throwing this error so we can re-provision it and bring our local environment back to 100% consistency.
ubuntu@microk8s-vm:~$ sudo microk8s kubectl logs -l app=nginxdep --tail=5
10.1.23.1 - - [21/Sep/2020:00:35:14 +0000] "GET / HTTP/1.1" 200 612 "-" "curl/7.58.0" "-"
10.1.23.1 - - [21/Sep/2020:00:35:23 +0000] "HEAD / HTTP/1.1" 200 0 "-" "curl/7.58.0" "-"
2020/09/21 00:32:38 [error] 29#29: *146 directory index of "/usr/share/nginx/html/" is forbidden, client: 10.1.23.1, server: localhost, request: "HEAD / HTTP/1.1", host: "192.168.6.4"
2020/09/21 00:35:24 [error] 29#29: *147 directory index of "/usr/share/nginx/html/" is forbidden, client: 10.1.23.1, server: localhost, request: "HEAD / HTTP/1.1", host: "192.168.6.4"
This isn’t very helpful. We can see the error is definitely occurring within this application. We can also see the index is forbidden for one of the pods, but it’s not clear which one. We could delete all the pods and start from scratch at this point, but we want to see which bug caused this behavior so we can ensure it doesn’t propagate to production. So we’ll just have to keep investigating.
Since we know the permissions of this /usr/share/nginx/html/ folder is forbidden, we can write a one-liner script to show us the status of all the container directories to find our problem pod.
“Simply” find the list of pods, iterate through the list to execute our command, and gather the output of the `ls -alh` command; afterward, it’s a matter of playing a quick game of “Where’s Waldo.” To do this, we can use this “easy to remember and type” command:
for i in $( \
  sudo microk8s kubectl get pods -l app=nginxdep -o jsonpath='
    {range .items[*]}
      {.metadata.name}
    {end}'); \
  do printf "\n"$i"\n" && \
    sudo microk8s kubectl exec -it $i -- \
      ls -alh /usr/share/nginx/html/; \
done
This results in the following:
...
nginxdep-5f85bd7fb4-g75fc
total 16K
drwxr-xr-x 2 root root 4.0K Sep 10 12:33 .
drwxr-xr-x 3 root root 4.0K Sep 10 12:33 ..
-rw-r--r-- 1 root root  494 Aug 11 14:50 50x.html
-rw-r--r-- 1 root root  612 Aug 11 14:50 index.html
nginxdep-5f85bd7fb4-hg7xp
total 24K
drwxr-xr-x 1 root root 4.0K Sep 21 00:27 .
drwxr-xr-x 1 root root 4.0K Sep 10 12:33 ..
-rw-r--r-- 1 root root  494 Aug 11 14:50 50x.html
-rw-r--r-- 1 root root  612 Aug 11 14:50 index.html.whoops
nginxdep-5f85bd7fb4-j9lnv
total 16K
drwxr-xr-x 2 root root 4.0K Sep 10 12:33 .
drwxr-xr-x 3 root root 4.0K Sep 10 12:33 ..
-rw-r--r-- 1 root root  494 Aug 11 14:50 50x.html
-rw-r--r-- 1 root root  612 Aug 11 14:50 index.html
...
And there’s our problem pod and the reason for our error. It was a lot of work to get here, but it appears we’ve hit a race condition in NGINX where if you race to get to lunch too quickly, you might forget to revert a file change or delete an experimental pod.
rKubeLog Simplifies Debugging
Even with all the capabilities and tools provided out of the box and the fact we were able to accomplish our goal, there must be an easier way for our developers to do what they do best without being forced to string together multiple tools to find an obscure outcome.
There’s a solution designed to let us do this without substantial overhead and installation complexity: the rKubeLog open-source connector from SolarWinds.
rKubeLog is a lightweight application designed to run in your Kubernetes cluster and watch the Kubernetes API for logs. It ships those logs to SolarWinds Papertrail for any sleuthing you wish to do.
Setting Up rKubeLog
Setting up rKubeLog is straightforward with the modern-day kubelet integration of kustomize. It takes just three steps:
- Clone and browse to the rKubeLog repo
- Add your details for Papertrail to the kustomize.yaml
- Build your configs and apply them to your cluster
Now you can watch your logs automatically import for any application deployed to your local cluster.
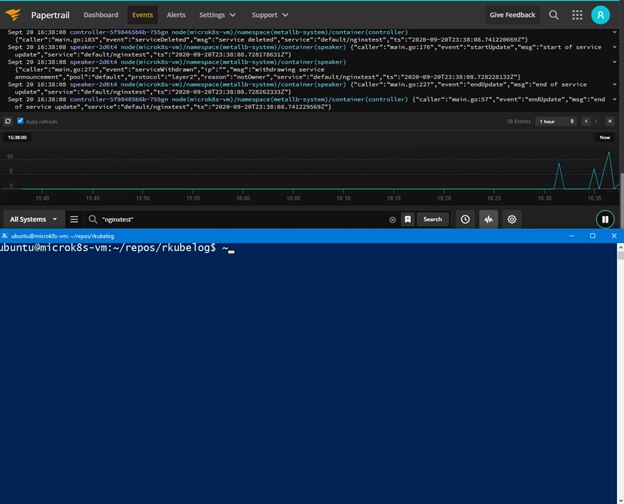
Here’s an example of creating and testing a pod with Papertrail. We can deploy a fresh instance of NGINX into our local cluster and watch as calls are automatically shipped to Papertrail without any special configuration.
Debugging with rKubeLog and Papertrail
Would Papertrail have quickly shown us our follies from earlier?
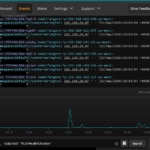
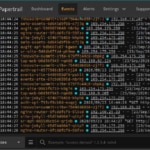
By using rKubeLog in tandem with Papertrail, a quick search for “403” would have resulted in all the information we needed without any on-the-fly scripting. We would’ve quickly understood and tracked down our issue.

By querying for our “403” errors from before, we can immediately see the single server returning those errors for us to immediately drill in or simply replace our problematic pod.
By aggregating the logs with Papertrail, using the quick, Google-like search, and having the ability to tail live log data, we can easily identify issues and start debugging our problems.
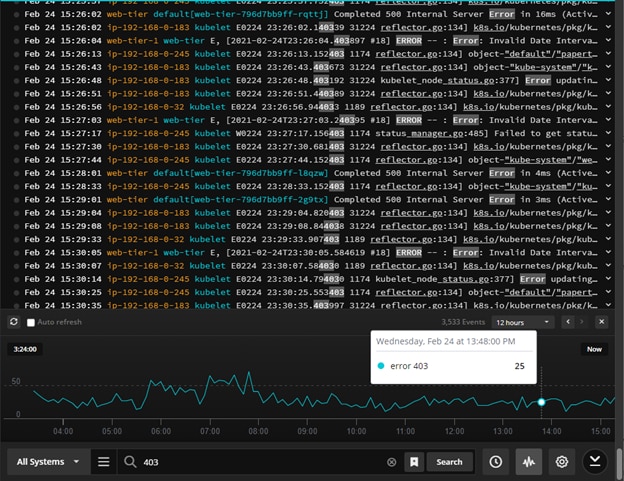
The search and log velocity view in the Papertrail event viewer makes it easy to find the client 403 errors on the server side.
Summary
At first glance, gathering logs in local Kubernetes environments appears to be straightforward and scalable. Kubernetes gives you the tools to interact with the environment and eventually make anything you need possible. However, there are easier ways of doing things, and Kubernetes allows plug-ins for a reason. Using rKubeLog with Papertrail, we can see just how much easier our lives can be when using a plug-in to manage and debug your development environments.