Debugging and resolving incidents in nodeless environments can be difficult, time-consuming, and most of all, frustrating. Exporting your logs from these ephemeral and disparate services to a centrally aggregated log is a great way to correlate information, quickly resolve incidents, and make your life a little easier.
In this post, we’ll look at the process and benefits of exporting logs from a nodeless environment such as AWS EKS on Fargate to a central cloud solution using SolarWinds® Papertrail™ and rKubeLog.
What Is Fargate?
First let’s start with AWS Fargate. Fargate is an ephemeral collection of server nodes on Amazon managed Elastic Kubernetes Service (EKS). This means two things:
- We don’t have hands on the underlying nodes.
- We don’t have hands on the underlying control plane.
And since these are our two primary points of contact when trying to determine the most scalable way of deploying something like logging infrastructure, we don’t have any way of systemically deploying consistent log collection agents across our entire fleet to collect the logs at a server level.
The Standard Manual Process
First, let’s look at the standard, manual way of logging. In this abstracted environment, we can easily set up applications in a standardized way using Kubernetes kubectl commandlet just like we would in a local or fully managed cluster.
With a few simple commands, we can have an entire load-balanced application deployed in Fargate ephemeral environments without spinning up a single manual VM. However, seeing how these applications behave can prove to be difficult.
$ kubectl get pod,svc,ep,ingress -l app=solartest
NAME                             READY   STATUS    RESTARTS   AGE
pod/solartest-797446c5b6-5g9l8   1/1     Running   0          108s
pod/solartest-797446c5b6-9tb6t   1/1     Running   0          108s
pod/solartest-797446c5b6-bjzx6   1/1     Running   0          116s
pod/solartest-797446c5b6-bljxm   1/1     Running   0          108s
pod/solartest-797446c5b6-cgb6f   1/1     Running   0          108s
pod/solartest-797446c5b6-chj2k   1/1     Running   0          108s
pod/solartest-797446c5b6-gszw4   1/1     Running   0          108s
pod/solartest-797446c5b6-pwd5q   1/1     Running   0          108s
pod/solartest-797446c5b6-q4q6g   1/1     Running   0          108s
pod/solartest-797446c5b6-qzfkk   1/1     Running   0          108s
NAME                TYPE        CLUSTER-IP       EXTERNAL-IP   PORT(S)   AGE
service/solartest   ClusterIP   10.100.121.229   <none>        80/TCP    95s
NAME                  ENDPOINTS                                                             AGE
endpoints/solartest   192.168.102.117:80,192.168.111.247:80,192.168.123.71:80 + 7 more...   95s
NAME                           HOSTS   ADDRESS                                                                 PORTS   AGE
ingress.extensions/solartest   *       2339a39a-default-solartest-9b59-649674117.us-west-2.elb.amazonaws.com   80      63s
Fargate doesn’t support DaemonSets to deploy our normal FluentD or Telegraf monitoring mechanisms. So, how do we consistently deploy monitoring to our applications? AWS recommends adding sidecars to each of our pods, but that requires more resources than we should have to manage and pay for.
We could investigate logs manually using kubectl’s ability to query the API using labels. However, this output is somewhat vague, as it doesn’t show us which pods are showing what results
$ for i in $(kubectl get pods -l app=solartest -o jsonpath='{range .items[*]} {.metadata.name} {end}'); do printf "\n"$i"\n" && kubectl logs $i --tail=2; done
solartest-797446c5b6-5g9l8
192.168.29.47 - - [21/Sep/2020:19:56:07 +0000] "GET / HTTP/1.1" 200 612 "-" "ELB-HealthChecker/2.0" "-"
192.168.63.162 - - [21/Sep/2020:19:56:11 +0000] "GET / HTTP/1.1" 200 612 "-" "ELB-HealthChecker/2.0" "-"
solartest-797446c5b6-9tb6t
192.168.29.47 - - [21/Sep/2020:19:56:07 +0000] "GET / HTTP/1.1" 200 612 "-" "ELB-HealthChecker/2.0" "-"
192.168.63.162 - - [21/Sep/2020:19:56:11 +0000] "GET / HTTP/1.1" 200 612 "-" "ELB-HealthChecker/2.0" "-"
solartest-797446c5b6-bjzx6
192.168.29.47 - - [21/Sep/2020:19:56:07 +0000] "GET / HTTP/1.1" 200 612 "-" "ELB-HealthChecker/2.0" "-"
192.168.63.162 - - [21/Sep/2020:19:56:11 +0000] "GET / HTTP/1.1" 200 612 "-" "ELB-HealthChecker/2.0" "-"
solartest-797446c5b6-bljxm
192.168.29.47 - - [21/Sep/2020:19:56:07 +0000] "GET / HTTP/1.1" 200 612 "-" "ELB-HealthChecker/2.0" "-"
192.168.63.162 - - [21/Sep/2020:19:56:11 +0000] "GET / HTTP/1.1" 200 612 "-" "ELB-HealthChecker/2.0" "-"
solartest-797446c5b6-cgb6f
192.168.29.47 - - [21/Sep/2020:19:56:07 +0000] "GET / HTTP/1.1" 200 612 "-" "ELB-HealthChecker/2.0" "-"
192.168.63.162 - - [21/Sep/2020:19:56:11 +0000] "GET / HTTP/1.1" 200 612 "-" "ELB-HealthChecker/2.0" "-"
solartest-797446c5b6-chj2k
192.168.29.47 - - [21/Sep/2020:19:56:07 +0000] "GET / HTTP/1.1" 200 612 "-" "ELB-HealthChecker/2.0" "-"
192.168.63.162 - - [21/Sep/2020:19:56:11 +0000] "GET / HTTP/1.1" 200 612 "-" "ELB-HealthChecker/2.0" "-"
solartest-797446c5b6-gszw4
192.168.63.162 - - [21/Sep/2020:19:56:11 +0000] "GET / HTTP/1.1" 200 612 "-" "ELB-HealthChecker/2.0" "-"
192.168.72.187 - - [21/Sep/2020:19:56:15 +0000] "GET / HTTP/1.1" 200 612 "-" "ELB-HealthChecker/2.0" "-"
solartest-797446c5b6-pwd5q
192.168.63.162 - - [21/Sep/2020:19:56:11 +0000] "GET / HTTP/1.1" 200 612 "-" "ELB-HealthChecker/2.0" "-"
192.168.72.187 - - [21/Sep/2020:19:56:15 +0000] "GET / HTTP/1.1" 200 612 "-" "ELB-HealthChecker/2.0" "-"
solartest-797446c5b6-q4q6g
192.168.63.162 - - [21/Sep/2020:19:56:11 +0000] "GET / HTTP/1.1" 200 612 "-" "ELB-HealthChecker/2.0" "-"
192.168.72.187 - - [21/Sep/2020:19:56:15 +0000] "GET / HTTP/1.1" 200 612 "-" "ELB-HealthChecker/2.0" "-"
solartest-797446c5b6-qzfkk
192.168.63.162 - - [21/Sep/2020:19:56:11 +0000] "GET / HTTP/1.1" 200 612 "-" "ELB-HealthChecker/2.0" "-"
192.168.72.187 - - [21/Sep/2020:19:56:15 +0000] "GET / HTTP/1.1" 200 612 "-" "ELB-HealthChecker/2.0" "-"
To go further, we’ll need to get into the tedious process of tailoring our queries, trying to identify problematic hosts, or debugging information to better understand our issues.
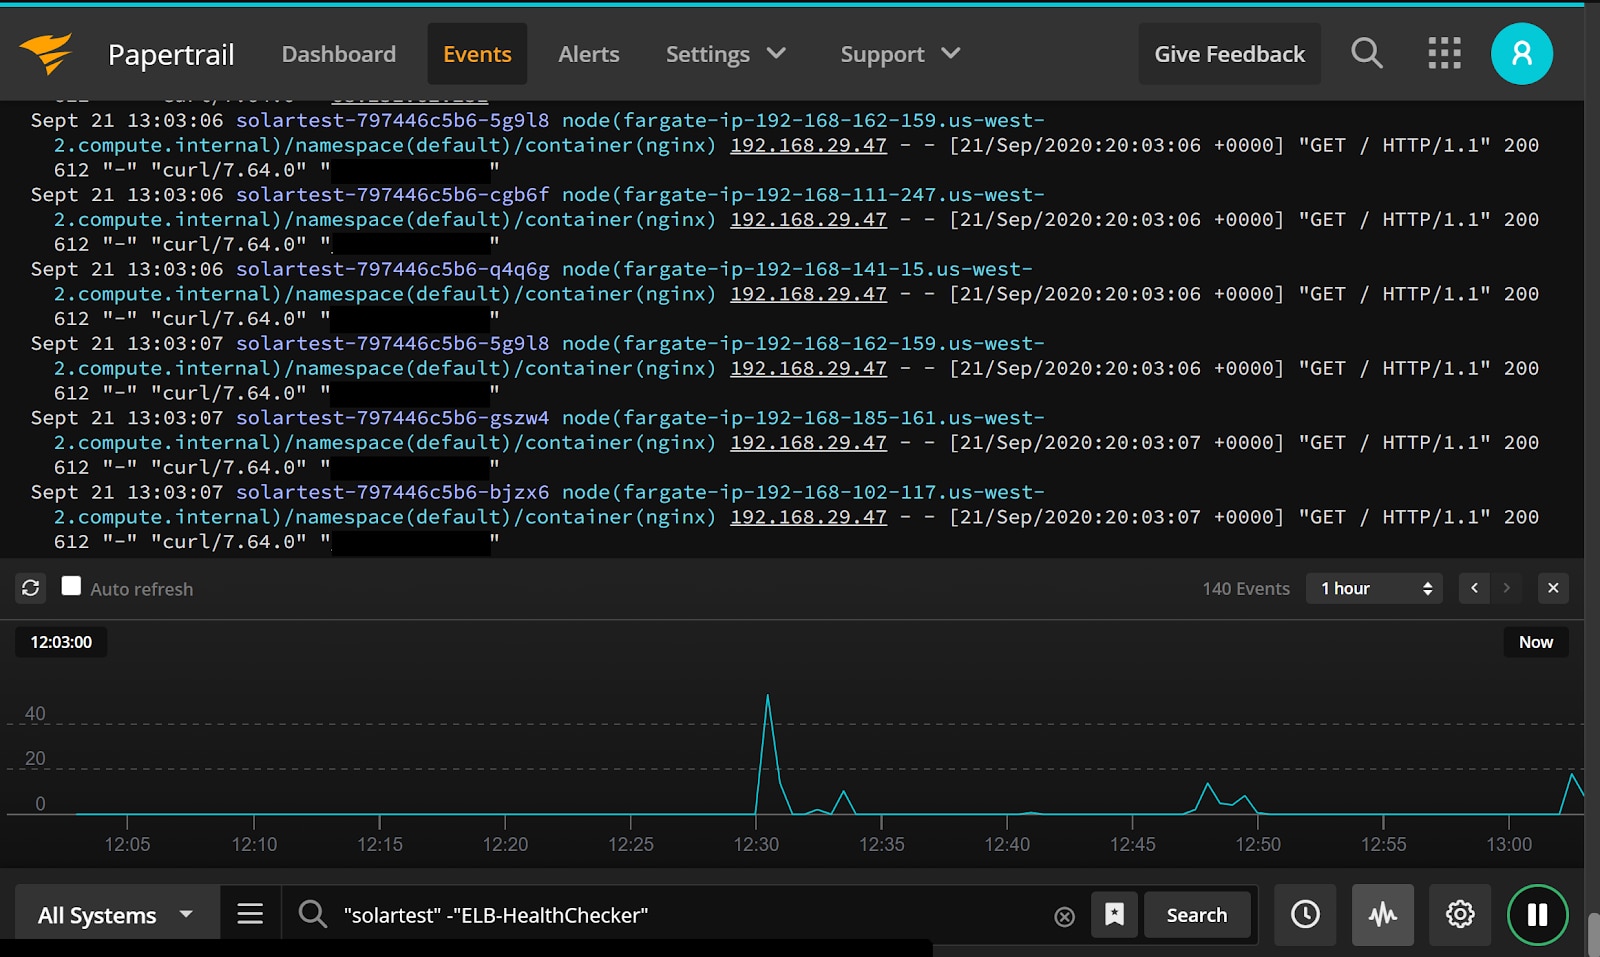
Better With Papertrail
By using similar functionality as our local kubectl, we can use rKubeLog to take these logs from the Kubernetes API and ship them to a central provider such as Papertrail. Using rKubeLog and Papertrail has massive benefits, such as:
- Full history
- Friendly, easy-to-use interface
- Simple configuration and deployment
- Less overhead than sidecar log exporters as proposed by AWS
As you can see here, we have all the information we need: full container IDs, server names, and grepable logs, all from a single interface.
Walkthrough
The install is very straight forward:
Step 1: Clone the repository.
Step 2: Edit the kustomization.yaml to include your Papertrail log location
Step 2: Edit the kustomization.yaml to include your Papertrail log location
Instead of 10 extra containers for our solartest deployment to have a log aggregation agent, we can simplify our infrastructure to a single agent that watches all of our cluster logs.
kubectl get pods -n kube-system -l app=rkubelog
NAME                        READY   STATUS    RESTARTS   AGE
rkubelog-67db97ddcb-wf7cx   1/1     Running   0          12m
By simplifying the aggregation process and providing intuitive log manipulation and dashboards, you save developer time and resources. By reducing capacity requirements from one sidecar per pod to one pod per cluster, you save money and infrastructure complexity.
Summary
Designing applications at scale means also operating applications at scale. Setting up logging and observability is a key component to understanding complex systems and maintaining healthy operations. While opinionated providers like AWS Fargate promise simplicity in management, they also take away our extensibility by removing access to control planes and host-level resources. When this happens, we can reach for simple plugins like rKubLlog to simplify our workflows, saving time and money.
To learn more about how to access, set up, and use rKubeLog, read the rKubeLog article in the SolarWinds Papertrail knowledge base.