Today we’re going to talk about logging with Kubernetes on AWS using CloudWatch and SolarWinds® Papertrail™. We’ll cover setting up Papertrail, installing and configuring the rKubeLog package, viewing the logs in the Papertrail event viewer, and cross-checking those logs with the ones we see with kubectl. From there, we’ll set up a few different alerts.
Papertrail supports most log types and is easy to configure with multiple services, applications, and cloud providers. It can aggregate from other logging services such as CloudWatch as well. It looks a lot like Log4j, so it should feel familiar to software engineers. This is great for people who have multi-cloud setups who want to aggregate logs from different CloudWatch groups. It’s also very lightweight, and the solution we’re using today doesn’t require any sidecars, ELK stacks, or the like. Once it’s all configured, it will monitor logs from all your pods across all namespaces.
One simple kubectl apply, and we have logging!
Since all we require is kubectl, this is also a good choice for groups who prefer to do their dev work on minikube and deploy to AWS or another cloud provider, but want the same setup for dev and prod.
What’s Required?
You’ll need to sign up for an account with Papertrail. It’s free to get started, and no credit card is required. If you decide to pull logs from more applications or your event volume increases, you can check out their plans. Everything in this tutorial is under the free plan.
Once you’ve created an account login, you’ll see an interface showing you how to set up some of the connections. For this tutorial, we won’t be using the standard logging setups; instead we’ll be using this Github repo. You’ll only need to get your Papertrail credentials, and from there you’ll be using the kubectl tool.
This tutorial assumes you already have an EKS or Fargate cluster setup on AWS, and we don’t go over that setup. If you’re just trying this out, the easiest method to get a cluster is to log in to the AWS Console, select EKS service, and create a new cluster from the console. My preferred method is to use Terraform to deploy a Rancher instance, and then use the Terraform Rancher Provider. If you’re looking to try out Papertrail, you can also use minikube.
Create a Logging Destination
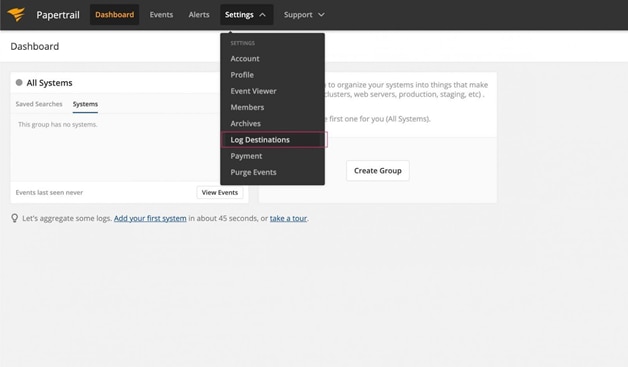
To create a log destination in Papertrail and get the credentials you need to run rKubeLog, go to Settings -> Log Destinations.
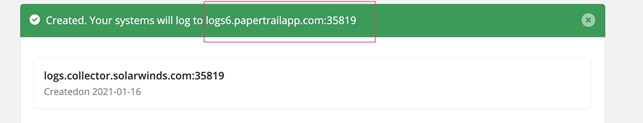
Keep everything as defaults, scroll down, and press Create. If all goes according to plan, you should see a green message at the top with your credentials.
Now, head on over to the console with your kubectl pointing at the cluster you’d like to use to log with Papertrail.
Install the Papertrail Deployment
To install rKubeLog, go to the GitHub Repo Releases page and grab the latest release. At the time of this writing, that’s 17.
Create Kubernetes Secrets
You can create your secrets in whatever way you prefer, including Terraform. For the sake of simplicity, I’m going to modify the kustomization.yaml supplied and then apply it all at once. Make sure to delete the secretGenerator key if you’re creating your secrets using a different method.
#kustomization.yaml
# ...
secretGenerator:
- name: logging-secret
  literals:
  - PAPERTRAIL_PROTOCOL="tls"
  - PAPERTRAIL_HOST="logs6.papertrailapp.com"
  - PAPERTRAIL_PORT="35819"
  - LOGGLY_TOKEN=""
  type: Opaque
Then apply it.
kubectl apply -k .I’m only using this as a demo, and I’m deleting it as soon as this tutorial is finished. If you aren’t behind a firewall, you should encode your variables.
Troubleshooting
If you get an error, make sure you’ve removed the secretGenerator key from the kustomizations.yaml file, or else your secrets will get clobbered with demo variables.
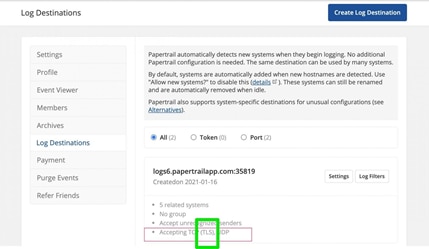
Pay attention to your input types. The Papertrail default is TLS, but the default protocol in the kustomizations.yaml is TCP. If you don’t know which type you chose, go to the Papertrail Settings -> Log Destinations menu. You’ll see what is currently set, and if need be select the Settings option to the right to make changes.
Check the Pods
kubectl get pods -n kube-system | grep rkubeGrab your pod name to check out its logs in the next steps.
Do Something Cool
Now that everything is set up, it’s time to generate events. You can dust off your “Hello World” code, install NGINX, or access an existing service. This cluster is a demo JupyterHub cluster, which is perfect for testing and seeing events.
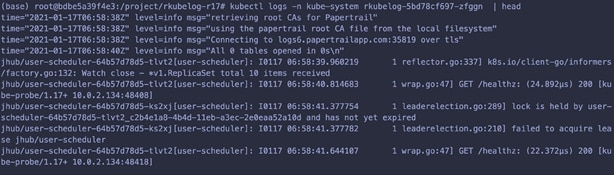
kubectl logs -n kube-system rkubelog-5bd78cf697-d2wqvYou should see some events based on your input activity.
Check Out Your Logs on Papertrail
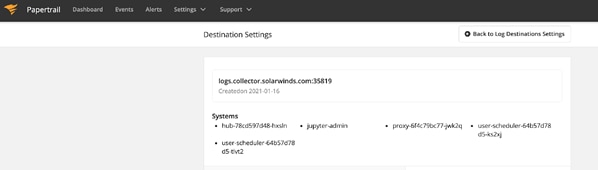
Now that events are flowing, let’s head back to Papertrail and check out the logs in the event viewer. Once in Papertrail , go to Settings -> Log Destinations -> Your Log Destination Settings. You should see systems that correspond to your K8s pod names.
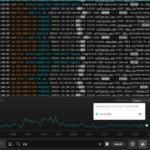
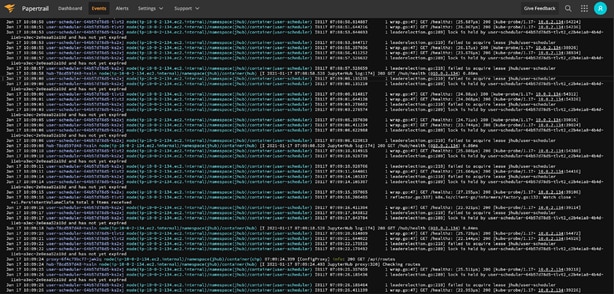
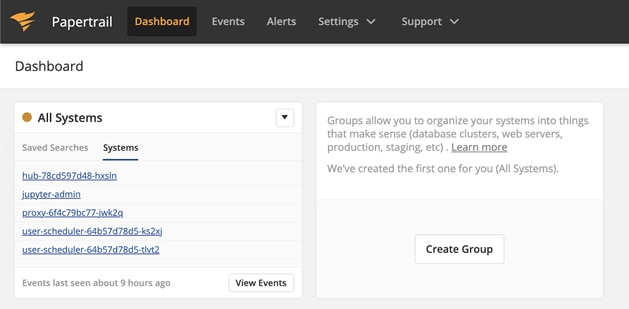
Now, go to Events to access the event viewer. You should see the event messages tagged with the Kubernetes pod names, in my case hub-78cd597d48-hxsin.
Papertrail Systems
Papertrail automatically tags the events with the different system names, which correspond to the Kubernetes pod names. These are formatted differently (darker blue), and you can click on them to filter by them. For example, in my JupyterHub, you can see a proxy, login hub, and some user pods. The ability to filter and search event by pod name is a great time saver when troubleshooting.
If you want to double-check the Papertrail Systems, run:
kubectl get pods -n my-namespaceOf course, you won’t see any events unless the pod creates some output.
Optional: Install NGINX
If you don’t have anything installed on your AWS EKS cluster, you can always install NGINX.
helm repo add bitnami https://charts.bitnami.com/bitnami
helm update
helm install my-nginx bitnami/nginx
Once it’s installed, grab the Load Balancer address, put it into a browser, and press Refresh a couple of times to get some logs going.
kubectl get svc | grep nginxCheck out the pod logs.
kubectl get pods
# Get the pod name
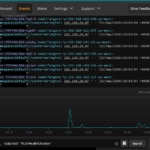
Now, open the Papertrail event viewer. You should see event messages tagged with a system ID corresponding to your NGINX pod. If you don’t, go back to the secrets step and make sure you have the correct input type. If you’re still having trouble, you can reach out to the Papertrail support team directly through the Live Chat option under the Support menu.
Getting and Fine-Tuning Alerts
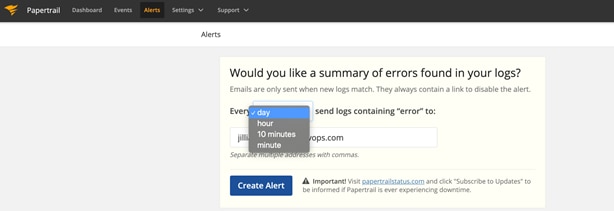
What good is logging if you don’t get a warning when something terrible happens or when users are doing something potentially deadly? Papertrail lets you setup alerts two ways. First, Papertrail is set up with a default alert, which will send you a daily email that aggregates messages from any logs with the word “error” in it. You can increase the frequency and add other types of alerts by opening the Alerts menu off the main navigation.
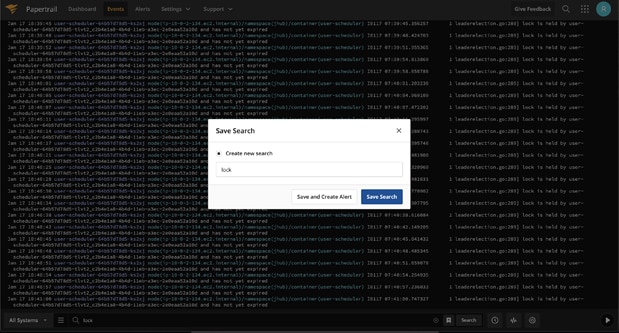
Papertrail also lets you create alerts right in the event viewer, as you’re searching. When you open the event viewer, you’ll see a search bar at the bottom of the screen. To search the event data, type in your search criteria and save the search. The search is easy to use and works a bit like the Google search bar. To create an alert, save the search. In the save search box, you’ll have the option to create an alert
Creating alerts from the search bar lets you create alerts while you’re troubleshooting, which is a great way to create an on-the-fly runbook and catch issues early.
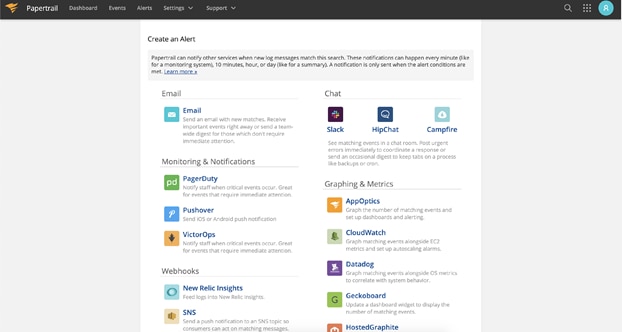
Papertrail alerts integrates with many different notification and communication services. Not only do you get an email integration, but you also get Slack, other chat programs, webhooks, Zapier, and AWS SNS, to name a few.
You could potentially do some nifty things with this. Say you have a user who’s trying to do something that requires more memory than they have. You could use AWS SNS to push a topic to give you a different EC2 instance as the underlying node group, or you could ping the user on Slack and say, “Hey, stop doing that.” Bonus points if you make the message come from a user account and not the Slack bot.
Setting up alerts is a much broader topic than I have the room to go into in this post. But if you’d like to learn more, check out the official Papertrail Alert docs.
Clean Up
If you’d like to clean up your demo environment, you can delete your Papertrail-associated K8s resources. Navigate back to the rKubelog folder and run:
kubectl delete -k .Troubleshooting
If you’re getting an error about the kubectl apply -k, you’re on an old version of kubectl. Install the newest version with:
curl -LO "https://storage.googleapis.com/kubernetes-release/release/$(curl -s https://storage.googleapis.com/kubernetes-release/release/stable.txt)/bin/linux/amd64/kubectl"
mv kubectl /usr/local/bin/kubectl
chmod 777 /usr/local/bin/kubectl
When I see something odd happening, and I can’t figure out what it is, I usually jump straight to describing the pods.
kubectl get pods -n kube-system | grep rkube
# get the pod name
kubectl describe pod -n kube-system rkube-some-numbers
If the pod’s running, you can also get the logs. But this won’t work if the pod is in a failed state, not running, not scheduled, and so on.
kubectl logs -n kube-system rkube-some-numbersPapertrail should be forwarding the logs directly from the pods. If you’re not getting logs, you can manually investigate them with the kubectl CLI. The best test is always NGINX because if NGINX doesn’t work, then you know the problem isn’t Papertrail.
helm repo add bitnami https://charts.bitnami.com/bitnami
helm update
helm install my-release bitnami/nginx
Wrap up
By now you should have rKubelog installed, configured, and forwarding your logs on over to the Papertrail. From here, you can start to think about what kinds of saved searches and dashboard views you need from your logs, and what triggers should be in place in case danger is on the way.