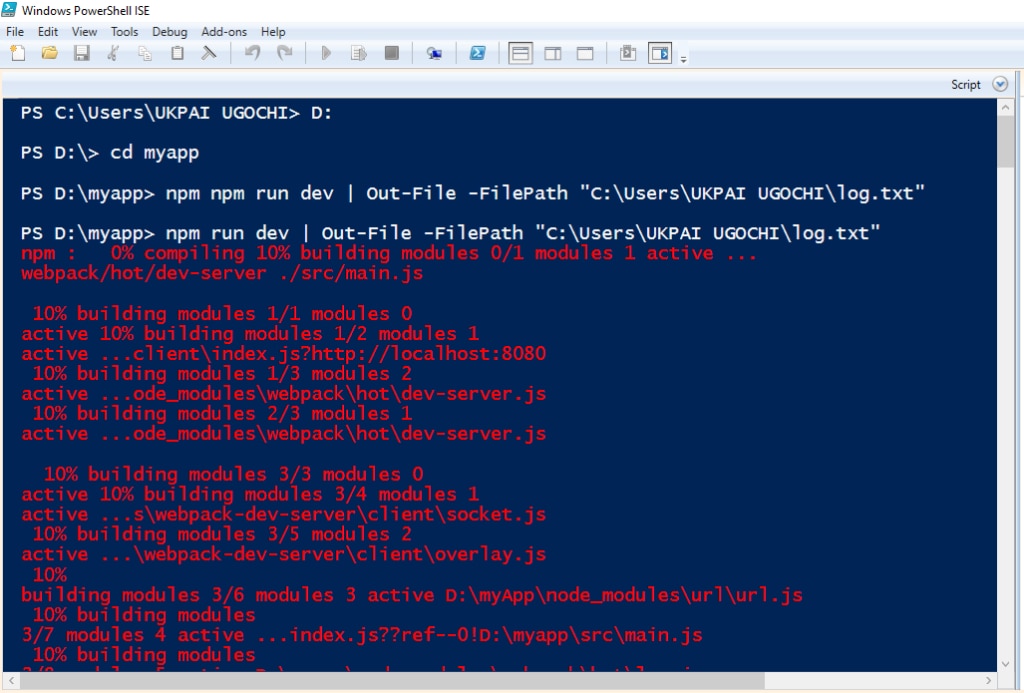
As you automate tasks with PowerShell, those tasks start to become more complex. As a result, logs become larger. Take a look at this huge log that was output from executing commands in PowerShell:
However, if the scripts you run on PowerShell are small and less complex, we won’t need to bother with logs. So, if smaller scripts bring smaller logs, should we avoid optimizing PowerShell usage?
But you may have other uses for PowerShell besides automating tasks. For example, you may want to use it to deploy your application to production. And in that case, you’ll not only want to have access to your logs while deploying but also have a copy of your logs. PowerShell gives you the ability to save your logs. But here comes the big question: How do we save and manage our logs efficiently?
Aggregating and Analyzing PowerShell Logs: The Essence
Microsoft released PowerShell in 2006 to supplement Windows CLI. PowerShell comes with cmdlet (command-let) instructions and administrative functionalities. With cmdlet, you can run simple commands on PowerShell. You can also group cmdlet for advanced scriptwriting.
Advanced and complex scripts may produce large logs that can be hard to handle. It can become impossible to trace your logs as you execute new commands. You may want to keep records of, retrieve, and analyze your logs without hassle. But this will become painstakingly difficult to achieve as logs become untraceable.
Aggregating logs helps developers keep track of logs since they are put together in a central group. This method allows users to keep similar files together in a group. I call this good housekeeping, because logs are properly organized in a way other developers can easily access them. Aggregating logs can help developers analyze them, and this, in turn, can improve security and shield your system from cyberattacks.
How to Aggregate PowerShell Logs
The reasons to aggregate and analyze PowerShell logs are undisputed. So, let’s dive into the different methods we can use to do this.
Categorize Entries With Logging Levels
When I say, “logging levels,” I simply mean categorizing your log entries. You’ve no doubt seen logs formatted in red to flag an error and some with a warning sign. The concept of logging levels is to arrange logs into different groups according to their levels. Logs may be classified as error, warning, verbose, fatal, debug, off, all, trace, and so on.
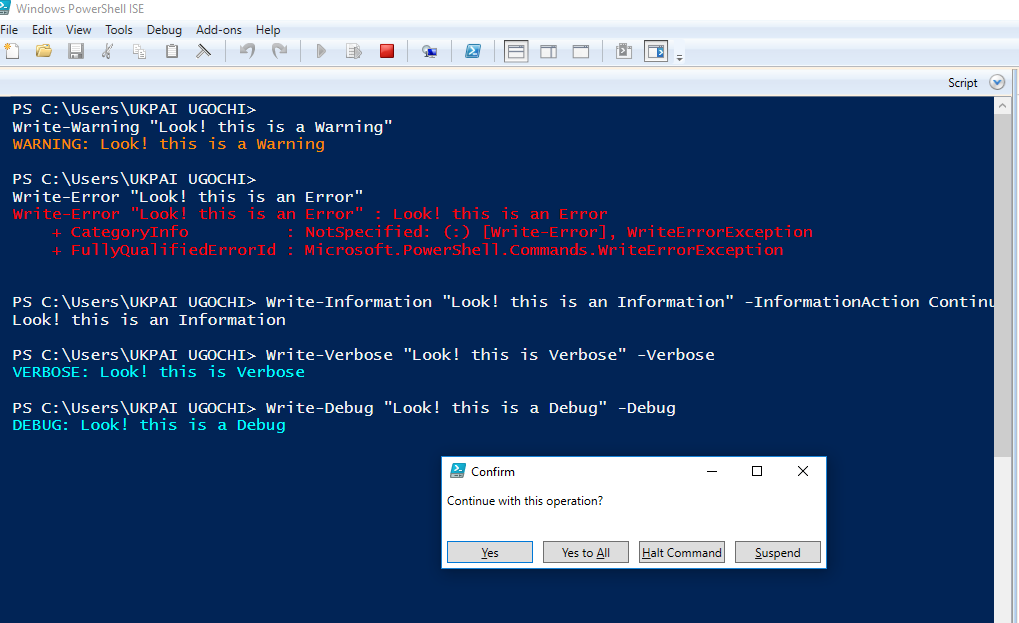
Logging levels is an important log aggregating method. After running a script, developers most times check logs for some logging levels. For instance, a developer may check logs for errors to see why a program failed. Grouping logs in this manner allows for easy searching and retrieval of logs. The program below shows how to group logs with a few different log levels:
# How to log the warning level:
Write-Warning “<message>”

# How to log the error level:
Write-Error “<message>”

# How to log the information level:
Write-Information “<message>” -InformationAction Continue

# How to log the verbose level:
Write-Verbose “<message>” -Verbose

# How to log the debug level:
Write-Debug “<message>” -Debug
/*This will ask if you want to continue operation, to allow step-by-step running of your scripts*/
As you can see in the image below, the developer has aggregated PowerShell logs by grouping them into different log levels.
Keep Records
Keeping records is the first step to retrieving and analyzing logs. After all, how do you find something you haven’t kept? PowerShell gives administrators the ability to store their logs in a file. When you save your logs in a file, you can easily retrieve them and even share them with others. Here’s how to log your script output into a file:
# Use this syntax to log output into a file without showing logs in the PowerShell console:
<COMMAND> | Out-File -FilePath “C:\Full File Path.txt”
# If you wish to view logs in the PowerShell console, use the method below:
Get-Content -Path “C:\Full File Path.txt”
# The expression below is to serve Vue.js operation; the output can be seen in the picture below:
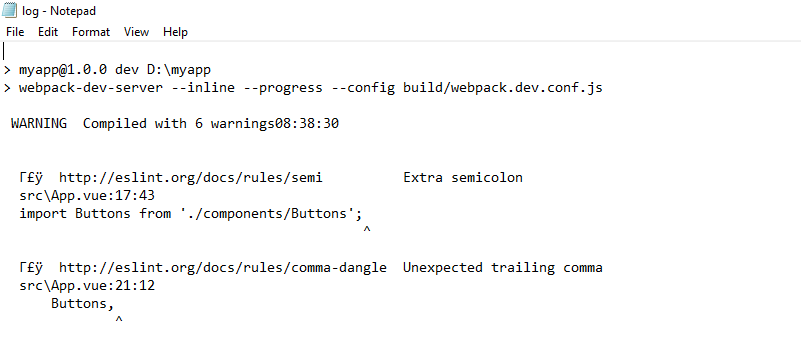
npm run dev | Out-File -FilePath “C:\Users\UKPAI UGOCHI\log.txt”
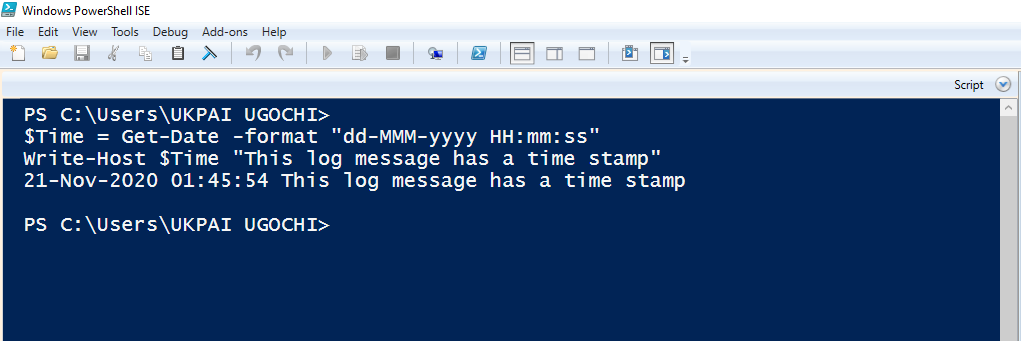
You can create different logs for different operations and tasks; this will help you group logs easily. It’s a good practice to keep related logs in the same folder for easy aggregation. You can also add a timestamp to the output logs; the logs will then include the time the program was executed.
# Use cmdlet Get-Date to assign current time attribute to $currentTime:
$currentTime = Get-Date -format “dd-MMM-yyyy HH:mm:ss”

# Add time to the log output:
Write-Host $currentTime “<message>”
I find saving logs in a file useful, especially when I want to monitor the deployment of an application to development or code builds. Accessing and keeping build logs is useful, as software can contain build and release messages to help new users quickly onboard to using the software.
Module logging allows the user to get logs of events and commands they execute with PowerShell. Although it doesn’t reliably capture all commands, module logging records output other sources don’t capture. The logs generated by module logging may become extremely large, which is why I prefer transcription. Transcription creates a timestamped record of every PowerShell session, including outputs and inputs, as they appear on the PowerShell console.
Configure Logging to Secure Sensitive Information
To harden your security posture and ensure you are logging everything it’s important to enable Script Block Logging. Once it’s enabled, script blog logging will record everything that PowerShell does. It is a great way to ensure you have a complete and auditable record of events. To enable script block logging, go to Windows PowerShell Group Policy Object settings and select Turn on PowerShell Script Block Logging.
Also, remember you shouldn’t log sensitive information like passwords, credit card numbers, API keys, etc. Fortunately, Windows 10 added a new functionality called Protected Event Logging. Protected Event Logging allows applications to encrypt sensitive data written to the event log. If you need to search or analyze these logs, you can decrypt and process these logs on a more secure and centralized log collector. Protected Event Logging is also enabled via Group Policy. There is more information on how to setup this powerful security feature here.
How to Analyze PowerShell Logs
Now that we’ve aggregated our logs, how can we analyze them?
Use PSFramework
Analyzing logs with PSFramework is top notch. PSFramework is a PowerShell framework designed to make scripting-specific challenges easier for users to execute. It’s one of the simplest way to handle PowerShell logs and configurations efficiently without incorporating an external tool. And PSFramework can do more than that; all you need to do is install this framework on your computer.
With PSFramework, you can log in to different files or multiple locations such as SQL, or Azure Log Analytics at the same time. You can customize log handling and monitor code flows with flow controls for better error handling. Let’s look at how to install and use PSFramework:
# Run PowerShell application on administrative rights by right clicking >> run as administrator.

# Install module:
Install-Module -Name PSFramework -RequiredVersion 1.0.19

# Register log file provider:
Set-PSFLoggingProvider -Name ‘logfile’ -Enabled $true

# Set file path to store logs:
Set-PSFLoggingProvider -Name logfile -Enabled $true -FilePath ‘C:Full file path.txt’

# Run a simple command and send logs to file. Logs contain more detailed information:
Write-PSFMessage -Level Important -Message ‘This process is a failure’ -Tag ‘Failure’
Managing Logs
The act of centrally collecting different log files and organizing the data in them for easy analyzing is aggregation. We’ve discussed various ways logs can be put into files for record keeping. We’ve also explored how categorizing logs into different log levels can help aggregate logs, the essence of configuring logs, and best practices for keeping PowerShell log records. Could there be another means to aggregate, analyze, and manage logs more efficiently?
PowerShell log aggregating tool is a great solution. Such a tool makes it possible for users to centralize logs and analyze them together in real time. After aggregating and analyzing logs, you can monitor them and get a summary of log data with aggregating tools.
How to Take PowerShell Log Aggregation and Analysis Further
In this post, we’ve seen why it’s essential to aggregate and analyze our PowerShell logs. We have also seen the different methods we can use to aggregate our PowerShell logs for analysis. I approve of using PowerShell for logging when it’s convenient. The documentation and security PowerShell provides is top notch.
The use of PSFramework is cool, and Papertrail makes it possible to easily analyze, centralize, and retrieve log summaries in your dashboard with real-life data. You can also integrate Papertrail with asynchronous development tools like GitHub and TravisCI. With this in place, your applications in GitHub can be easily deployed to production while documenting and analyzing logs in real time.
This post was written by Ukpai Ugochi. Ukpai is a full stack JavaScript developer (MEVN), and she contributes to FOSS in her free time. She loves to share knowledge about her transition from marine engineering to software development to encourage people who love software development and don’t know where to begin.
Looking for something else? You might also want to check out the SolarWinds log aggregation tool