Like with any software application, maintaining the app after deployment is critical. It’s important to have methods to check its status when issues inevitably arise. One of the first things most technical professionals will do when diagnosing issues is to check the logs. This way, you can dig deeper into an issue and determine the root cause.
With WordPress, this process is no different than with any other software application. WordPress has a few moving parts, including a web server, a PHP application, and a database. These things can run into issues, whereas having a good log management process will help solve issues and keeping things running well. Especially with the volume of logs from a prominent WordPress site, having a log management strategy in place is key.
There are three major steps in monitoring WordPress logs, which I’ll explore later:
- Aggregating all relevant logs into a single place
- Having the ability to quickly view and search logs for relevant information
- Setting up alerts to catch issues proactively based on repeated log criteria
Aggregating Logs in One Place
The first thing to do if you want to start managing and monitoring WordPress logs is to take the logs from the systems supporting your WordPress site and put them in a central location. If you leave the log files scattered in the various systems, you’ll end up wasting a considerable amount of time searching for the related log data when you’re troubleshooting an issue.
A side benefit of aggregating log files from supported systems is it’s easier to manage your log data and implement access control policies. If your WordPress logs contain sensitive information (passwords, credit cards, etc.), tightly controlling access is critical to meeting both security and regulatory requirements.
There are typically multiple systems supporting WordPress instances. The logs from these systems are the first place to start when considering aggregating logs:
- Operating system logs – used for any issues with the computer hosting the site, such as running out of hard drive space.
- Web server logs – used for handling any web server issues, such as the incorrect configuration of permissions. Common web servers include Apache, Ngnx, and IIS. The most useful log files include access.log and error.log,
- Database logs – used when dealing with database interactions. You can configure databases to log errors and even to log slow queries. Common databases include MySQL, IIS, PostrgreSQL, and Mongo DB.
- PHP/WordPress debug logs – catches any PHP errors thrown. These errors typically involve issues with plugins and broken asset links.
Most errors impacting a WordPress site will be recorded in one of these four systems, so being able to quickly access them makes it easier to troubleshoot issues. There are plenty of tools to help you automatically stream logs from these systems to a central place. Most of these tools also allow you to centrally search across logs to quickly find related events. SolarWinds® Papertrail™ is great example of an easy-to-use tool allowing you to centralize logs and to search and tail events.
Once the logs are in a central place, the next step is being able to view and make sense of the log data. Let’s look into how you can use these logs to analyze what’s going on in WordPress.
Quickly Viewing and Searching Logs
Once you have the logs in a single place, you can start sifting through the data. If you don’t have a log management tool, you’ll essentially be looking at large blocks of text. This will probably make it difficult to see patterns or identify issues. To start pulling out the useful data, you need to search and filter through all of it. Here are some of the common strategies.
- Search for specific issues based on matching text. This includes searching using User_ID, asset name, error type, IP address, etc.
- Filter logs based on a time frame. With the volume of logs, it’s important to reduce mental clutter by focusing on the time period in which errors occurred. This is frequently the first step when trying to both understand the root cause of a problem and see related events.
- Browse log data based on repeated information. This is a great approach if there’s little-to-no information on the reason for an error. You can look for different error sources or for specific time frames to triage events relevant for your current issue.
For example, a common source of errors on WordPress comes from out-of-date or malfunctioning plugins. When plugins fail, there usually isn’t a user-facing error. The plugin fails—hopefully gracefully, and perhaps functionality is missing for the user, which isn’t optimal, but the error itself is only logged internally.
Sometimes these plugin issues result in “PHP fatal error.” The event messages typically include information returned from the plugin, which will give you enough context to identify the failing plugin. If you can’t find any clues in the event message, but still suspect a plugin issue, you can always try searching for event messages written just before the PHP_fatal_error. If you see, for example, “Failed to load plugin url: http XXX” in the same time frame as the PHP_fatal_error, you can usually assume the PHP error is linked to a plugin problem.
Frustration-free log management. (It’s a thing.)
Aggregate, organize, and manage your logs with PapertrailSetting Up Alerts
Along with smart searches and filters, setting up alerts is great way to stay on top of WordPress issues. When thinking about the types of alerts to set up, a good place to start is by looking at your most frequent searches, or the searches you do regularly. For example, earlier I mentioned searching for the term “PHP fatal error.” Instead of waiting for the dreaded WSOD, “white screen of death,” or until users contact support, you’re better off catching these issues before there’s a user impact.
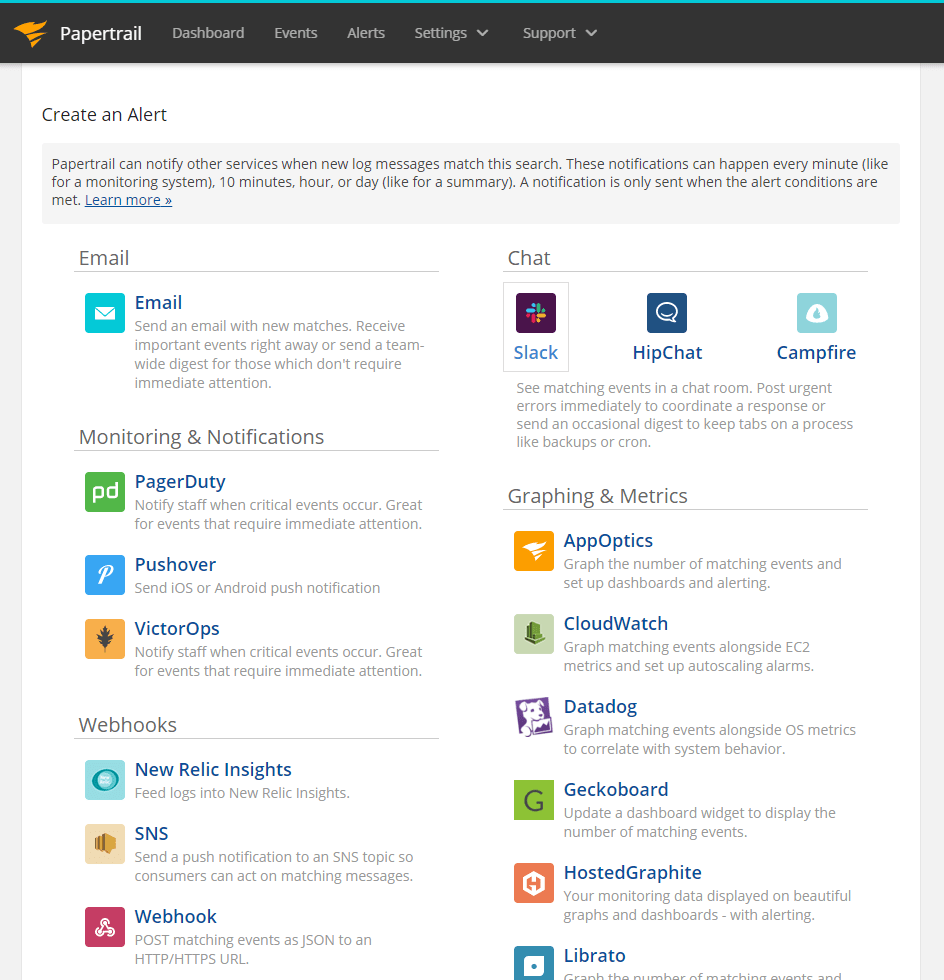
Most log management tools offer alerting. For example, Papertrail allows you to set up alerts right from the search bar. This is a great time saver. You can set up alerts while you’re troubleshooting, so you catch issues early if they happen again.
There are many different ways to receive alerts.
- Email – This is generally easy to set up, but the alerts can get lost in your inbox.
- SMS – This is a good option if you’re only sending a few alerts to one or two people but can get unwieldy if the alert volume or team is larger.
- Integration with ticketing and teaming tools (Slack®/ HipChat®/PagerDuty®/Victor Ops) – These take a bit more effort to set up but can provide more value. For example, scoping alerts to notify a subset of team members or automatically opening tickets for certain alert conditions.
Many times, setting up alerts is where off-the-shelf logging tools excel. A good notification system can be the most useful tool to catch and troubleshoot errors, so it’s important to invest in a log management tool suitable for your needs. Tools such as Papertrail come with a large collection of out-of-the-box notification integrations, which can allow you to customize an alerting system quickly and easily.
Monitoring Your WordPress Logs Efficiently
Aggregating, managing, and searching WordPress logs doesn’t need to be difficult. There are plenty of tools you can use to greatly simplify managing WordPress, web server, and database logs. A tool like Papertrail, which can be set up in minutes, is easy to use and provides everything you need out of the box.
- Log aggregation and management
- Fast searches across multiple log sources
- Robust alerting with support of Slack, PagerDuty. and others
If you’re looking for an easy solution for monitoring WordPress and other error logs, check out SolarWinds Papertrail.
This post was written by Dave Farinelli. Dave is a senior software engineer with over eight years of experience. His specialty is in providing enterprise-level solutions for healthcare and insurance clients. Dave holds a B.S. in computer engineering from Kettering University in Flint, Michigan.
Need something more? Don’t forget to visit the SolarWinds log aggregation tool