Maintaining a Kubernetes cluster is an ongoing challenge. While it tries to make managing containerized applications easier, it introduces several layers of complexity and abstraction. A failure in any one of these layers could result in crashed applications, resource overutilization, and failed deployments.
Fortunately, Kubernetes keeps comprehensive logs of cluster activity and application output. Kubernetes logging provides valuable insight into how containers, nodes, and Kubernetes itself is performing. Meticulously logging everything from Pods to ReplicaSets, it allows you to trace problems back to their source.
In this post, we’ll look at some common Kubernetes problems and how we can use logs to troubleshoot them.
Types of Logs
Kubernetes maintains two types of logs: application logs and cluster logs. Pods generate application logs, and include application code running in a container. The Kubernetes engine and its components, such as the kubelet agent, API server, and node scheduler, generate cluster logs.
Deployment Errors
Kubernetes Deployments can fail for a number of reasons, and the effects can be seen immediately. The cluster log documents most deployment-related errors.
Invalid Images
Using the wrong image in a Pod declaration can prevent an entire Deployment from completing successfully. An image error can be as simple as a misspelled image name or tag, or it could indicate a failure to download the image from a registry.
For example, let’s try to create an Nginx Pod:
$ kubectl run nginx --image=nginx:0.10
While there is an Nginx image on Docker Hub, there is no image with the “0.10” tag. kubectl runs successfully, but the Pod shows a status of ImagePullBackOff:
$ kubectl get pods
| Name | Ready | Status | Restarts | AGE |
|---|---|---|---|---|
| nginx-cbdb859bb-gn2h8 | 0/1 | ImagePullBackOff | 0 | 01m |
Kubernetes cluster logging has more information about the error:
Jul 23 12:33:43 minikube kubelet: E0723 16:33:42.826691 2740 pod_workers.go:186] Error syncing pod 2771d596-8e96-11e8-a08e-080027ced1d7 ('nginx-678c57c5cc-jcs5d_default(2771d596-8e96-11e8-a08e-080027ced1d7)'), skipping: failed to 'StartContainer' for 'nginx' with ImagePullBackOff: 'Back-off pulling image 'nginx:0.10''
...
Jul 23 12:34:24 minikube kubelet: E0723 16:34:24.472171 2740 remote_image.go:108] PullImage 'nginx:0.10' from image service failed: rpc error: code = Unknown desc = Error response from daemon: manifest for nginx:0.10 not found
Private registries are more complicated, since each node in your cluster must authenticate with the registry before pulling images. For example, let’s upload a modified Alpine Linux image to Google Container Registry. Although our nodes can reach the registry, they aren’t authorized to pull images from it. As with Nginx, the Alpine Pod is created, but its status is ImagePullBackOff and an error appears in the cluster log:
Jul 23 11:34:27 minikube kubelet: E0723 15:34:26.869958 2740 pod_workers.go:186] Error syncing pod f5e6d267-8e88-11e8-a08e-080027ced1d7 ('my-alpine_default(f5e6d267-8e88-11e8-a08e-080027ced1d7)'), skipping: failed to 'StartContainer' for 'my-alpine' with ImagePullBackOff: 'Back-off pulling image 'gcr.io/troubleshooting-k8s/alpine''
Insufficient Resources
Kubernetes tries to schedule Pods in a way that optimizes CPU and RAM usage, but once a resource is exhausted across the cluster, nodes can start to become unstable. New Pods can no longer be deployed, and Kubernetes will start evicting existing Pods. This can cause significant problems for applications, nodes, and the cluster itself.
To demonstrate this, we used the docker-stress container to exhaust RAM on our node. We configured the Pod to use 4 GB of RAM, then replicated it eight times:
# stress.yaml
apiVersion: apps/v1
kind: Deployment
metadata:
  name: stress
spec:
  selector:
  matchLabels:
    app: stress
  replicas: 8
  template:
  metadata:
      labels:
          app: stress
  spec:
      containers:
      - name: stress
          image: progrium/stress:latest
          imagePullPolicy: Always
          args: ['--vm', '1', '--vm-bytes', '4096M']
$ kubectl create -f stress.yaml
This initially caused several components to time out, including the controller itself:
Jul 26 11:11:11 kube-controller-manager kube-system[kube-controller-manager-minikube]: E0726 15:11:11.869623 1 replica_set.go:450] Sync 'default/stress-66479cfcf7' failed with the server was unable to return a response in the time allotted, but may still be processing the request (get replicasets.extensions stress-66479cfcf7)
As node resources become exhausted, Kubernetes will try rescheduling Pods to higher capacity nodes. If none are available, Kubernetes will start to evict Pods, which places Pods in the Pending state. You can prevent this by setting Pod resource limits, reducing the number of ReplicaSets, or by increasing the cluster’s capacity.
Operational Errors
A successful deployment doesn’t always mean your application is working. Errors can still occur long after the deployment is complete. These errors often occur within Pods and are recorded in their respective Pod’s log file.
Application Errors
Kubernetes automatically collects logs that containerized applications print to stdout and stderr. Each event is logged to a Pod-specific file, which can be accessed using kubectl logs.
For example, let’s run a “hello world” Python script with a typo in the print function:
# script.py
print('Hello world!')
# Dockerfile
FROM python:3.7.0-stretch
COPY script.py .
CMD ['python', './script.py']
$ docker build -t python-example Dockerfile
# python.yaml
apiVersion: apps/v1
kind: Deployment
metadata:
  name: python-example
spec:
  selector:
  matchLabels:
    app: python-example
  replicas: 1
  template:
  metadata:
      labels:
          app: python-example
  spec:
      containers:
        - name: python-example
          image: python-example:latest
          imagePullPolicy: IfNotPresent
$ kubectl create -f python.yaml
The Pod builds and runs without any issues, but the application fails with a status of Error. Viewing the Pod’s logs shows why:
Jul 23 13:05:17 python-example default[python-example-6fbdc7bd7c-6wqvn]: Traceback (most recent call last):
...
Jul 23 13:05:17 python-example default[python-example-6fbdc7bd7c-6wqvn]: NameError: name 'prnt' is not defined
No Network Access
Kubernetes uses a powerful overlay network with its own DNS service. It automatically assigns Pods a DNS record based on their name and the namespace where they were created. For example, a Pod named my-pod in the namespace kube-cluster can be accessed from another Pod using kube-cluster.my-service.
If a Pod can’t access another Pod, the DNS service might be failing. The DNS service itself runs as a Pod, which you can access using kubectl:
$ kubectl get pods --namespace=kube-system -l k8s-app=kube-dns
NAME                      READY   STATUS  RESTARTS   AGE
kube-dns-86f4d74b45-msw2f   3/3     Running   29      5d
This Pod hosts three containers: kubedns monitors the Kubernetes master for changes to Services and Endpoints; dnsmasq adds caching; and sidecar performs health checks on the service. For example, if the dnsmaq container is unavailable, the sidecar container will print a message like the following:
Jul 26 11:18:14 sidecar kube-system[kube-dns-86f4d74b45-msw2f]: W0726 15:18:14.145436 1 server.go:64] Error getting metrics from dnsmasq: read udp 127.0.0.1:53159->127.0.0.1:53: read: connection refused
Poor Node Health
Kubernetes has a built-in API for monitoring node events called the node problem detector. This deploys a Pod to each node that scans the node’s kernel log for new events.
$ kubectl create -f https://k8s.io/examples/debug/node-problem-detector.yaml
$ kubectl logs --name-space=kube-system node-problem-detector-v0.1-xkhw9
I0725 19:05:31.119316     1 kernel_monitor.go:93] Got system boot time: 2018-07-25 19:03:48.119309654 +0000 UTC
I0725 19:05:31.121793     1 kernel_monitor.go:102] Start kernel monitor
The detector currently won’t take any action in response to events. However, it’s an effective tool for detecting and reporting changes to nodes.
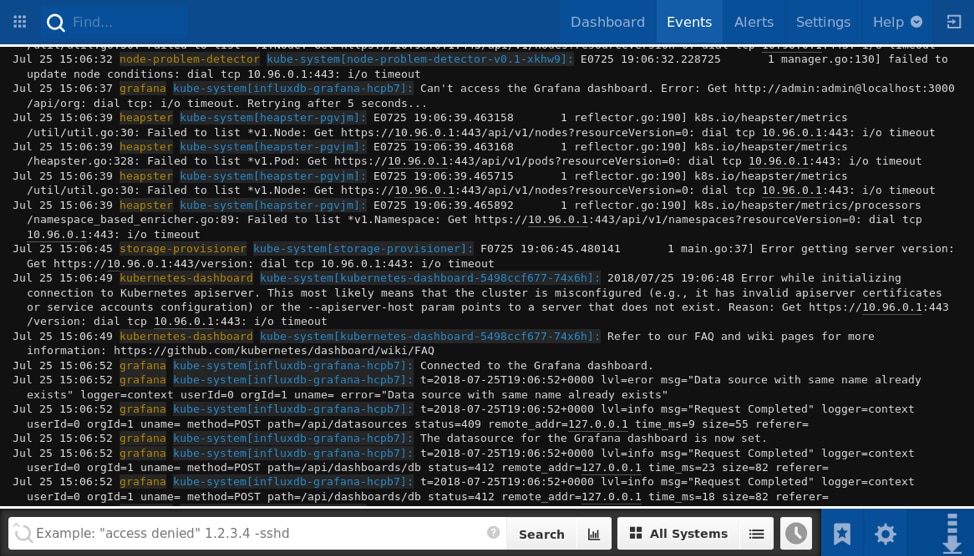
Monitoring Kubernetes Logs in Papertrail
Although kubectl lets you view logs, it doesn’t provide an easy way to centralize or monitor them. With the Papertrail™ solution, you can access logs from across your cluster from a single location, stream events in real-time, or filter events by component, resource, or date range. You can also set up alerts to automatically notify you in case of unexpected problems or unusual behavior.
Sending your Kubernetes logs to Papertrail is easy. With the logspout DaemonSet, Pod logs and master component logs are automatically forwarded with no additional setup. Each event is appended with the resource name (e.g. the Pod or container name) appearing in the System field, and the component that logged it appearing in the Program field.
Creating Alerts
Alerts can provide instant notifications when your cluster displays unusual behavior.
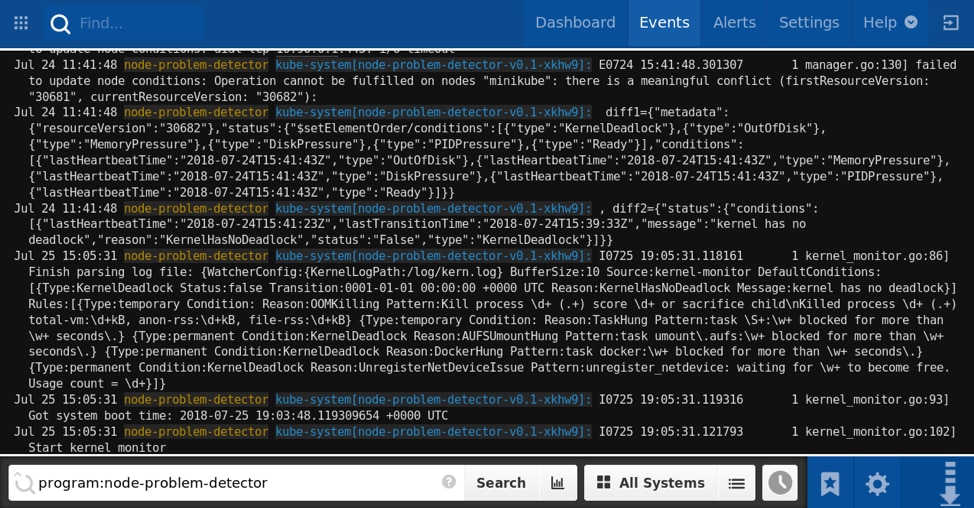
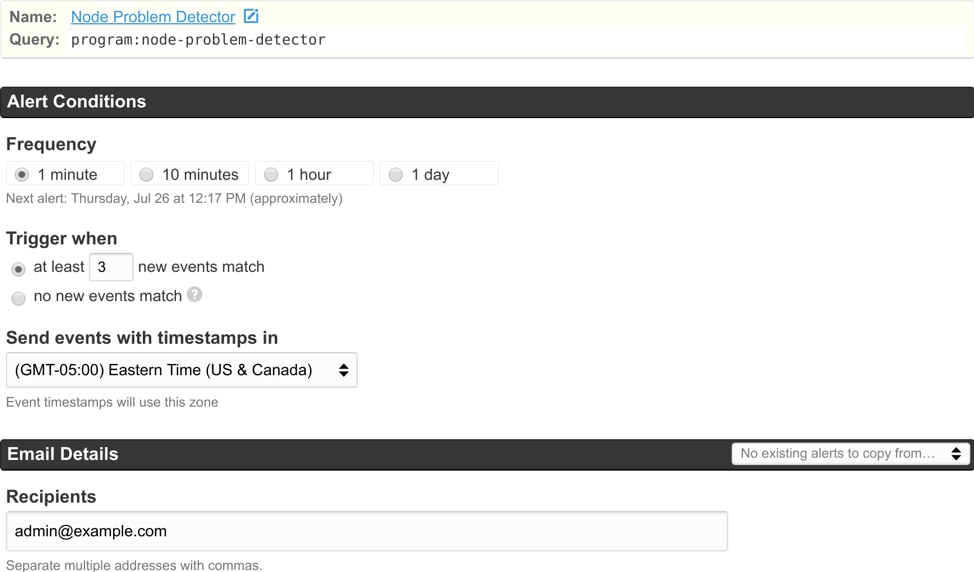
For example, you might want to be notified as soon as the node problem detector reports a new kernel event. You can create a search that filters your logs to those originating from node-problem-detector, then create an alert that triggers on each new event.
Conclusion
Kubernetes logs are rich with useful information about the state of your applications and nodes. Sending these logs to Papertrail can make it easy to monitor, filter, and search through events and troubleshoot problems faster. Sign up for a free trial of Papertrail and start sending your Kubernetes logs to Papertrail today.