Kubernetes work queues are a great way to manage the prioritization and execution of long-running or expensive menial tasks, such as processing large volumes of employee migration to a new system, ranking and sorting all the planets in the universe by Twitter tags, or even post-processing every frame of the latest Avengers movie.
Deploying a work queue is simple and easy to understand and, with the power of DigitalOcean managed Kubernetes services, can greatly reduce the operational burdens of managing your own clusters.
But what happens when your work queues experience issues and you don’t know where to start debugging? That’s where SolarWinds® Papertrail™ becomes the perfect complement to your deployment, allowing you to debug and find the root cause of the errors and get your work queue working efficiently.
In this series of two articles, we’ll look at ways you can use Papertrail to debug issues with a Kubernetes Work Queue deployed on DigitalOcean. In this first article, we’ll create a Kubernetes cluster with a work queue and deploy a complex job to it. We’ll walk through the quick and easy steps to get Papertrail set up to receive event messages. In the final article of this series, we’ll walkthrough different options for using Papertrail to manage and search Kubernetes logs and dive into troubleshooting the issues in the work queue we created. We’ll close this series with troubleshooting tips on identifying issues with work queues and a few best practices to prevent and correct them.
Creating a Kubernetes Cluster on DigitalOcean
First, we need to use DigitalOcean to create a Kubernetes cluster. DigitalOcean makes this easy and simple.
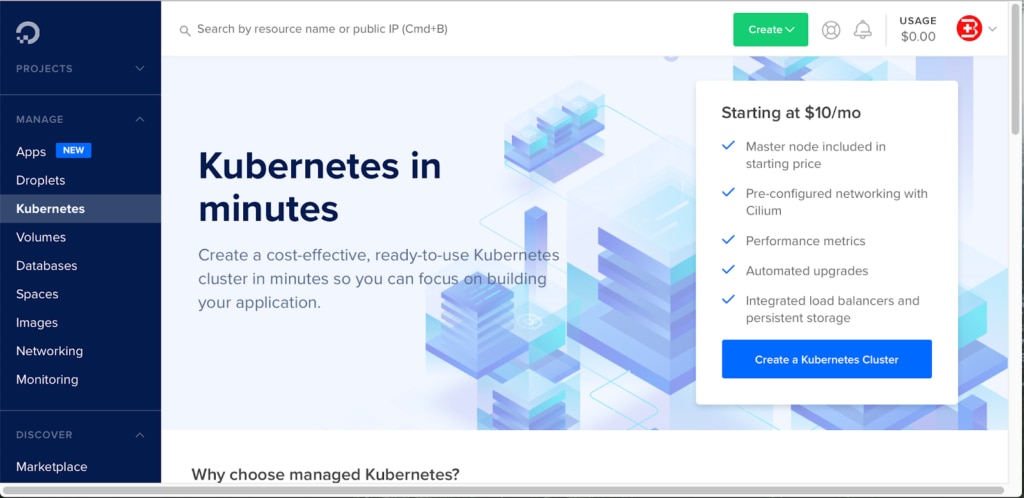
Go to the DigitalOceanConsole (as shown above), click on Kubernetes in the panel on the left side, and click Create Kubernetes Cluster at the bottom right. A pop-up wizard will prompt you for additional details, which include the following:
- Version number
- Location
- VPC network
- Cluster capacity (i.e., node-pool, droplet machine-type, node-plan, and number of nodes)
- Tags
- Name
- And so on…
Unless you want a different setup, keep these default settings, then click on Create Cluster at the bottom. With the default settings, you can provision the Kubernetes Cluster in approximately three to five minutes.
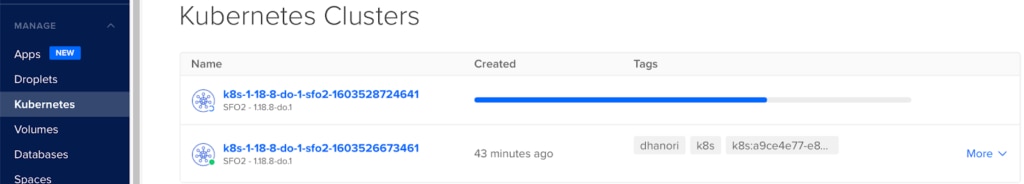
That was easy. There are now new nodes now provisioned for your Kubernetes cluster.
Now go back to the Kubernetes menu and click on your newly created Kubernetes cluster.
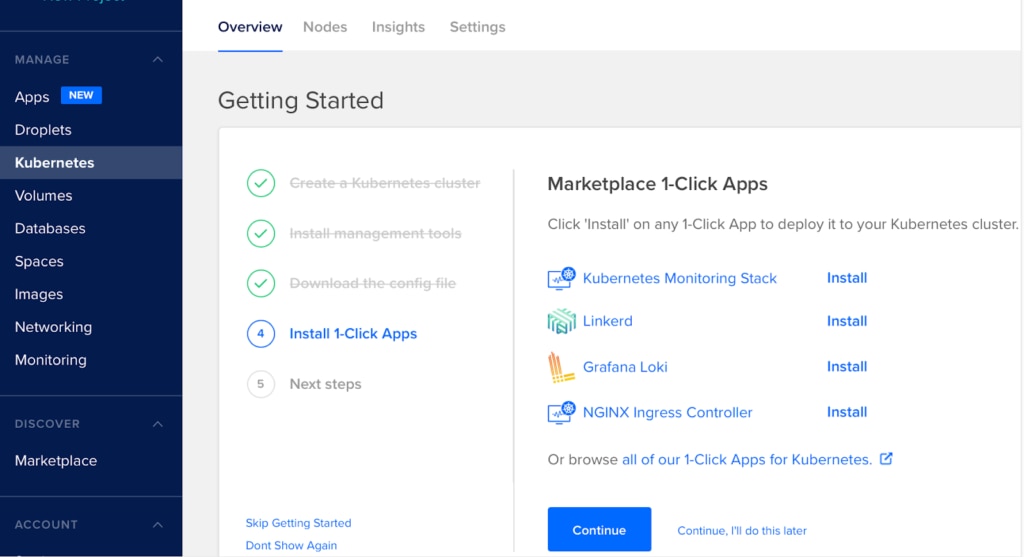
Install the DigitalOcean command-line tools (doctl) and the 1-Click App Kubernetes Monitoring Stack.
Next, run the following command in a terminal window, where the fc932c5e-94c8-4dd1-b8e0-a0fe36b6153d value comes from the cluster tag found in the overview section shown below:
$ doctl kubernetes cluster kubeconfig save fc932c5e-94c8-4dd1-b8e0-a0fe36b6153d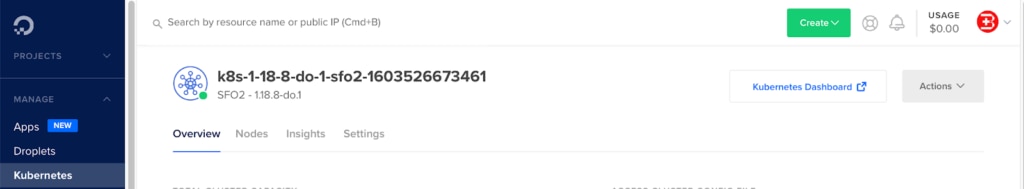
With the monitoring app installed, we can now see the details of our cluster by clicking on the Kubernetes Dashboard link. (See below for an example.)
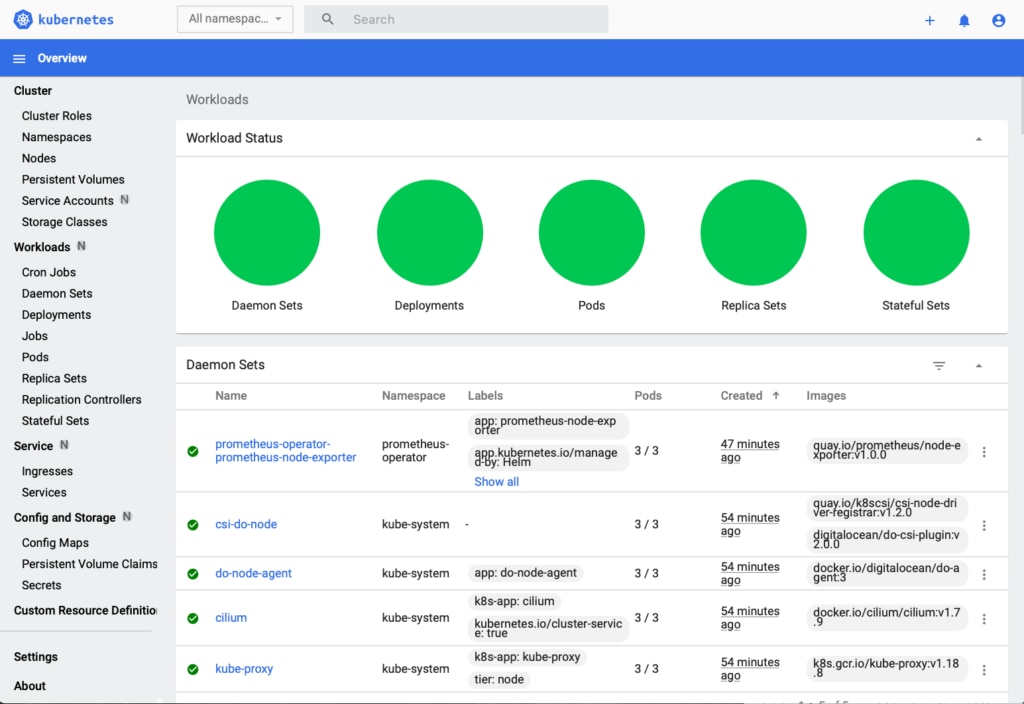
From the left-side menu, you can click Workload -> Jobs to see the details of the Kubernetes jobs currently running in your cluster. Of course, we don’t have any yet. So, let’s fix that! But first… What is a Kubernetes job?
What Is a Kubernetes Job?
While leveraging a Kubernetes cluster, it’s possible to implement a job-centric model where a large, complex piece of work can be decomposed into smallerpieces of work in a queue managed by a Kubernetes job. Each Job spawns a command worker created in the cluster (e.g., your custom-script running in the container). This command worker consumes items in the work queue. If the Job fails, then the Job Controller can reschedule and spawn another Job until the work queue depletes.
Kubernetes Jobs are designed for this type of batch execution. A Kubernetes Jobcreates one or more pods (the smallest deployable unit of computing workload, or a collection of application components, images, and infrastructure managed by Kubernetes directly) that executes commands, then either exits successfully or throws errors. After all associated pods exit successfully, the Kubernetes Job is assumed to be complete, and scheduled for deletion.
There are three common Kubernetes Job use cases:
- A simple Job using a single pod that runs once.
- A parallel Job using multiple pods with fixed completion counts. Kubernetes only considers them successful if a certain number of pods out of N pods complete the task; otherwise, the Job fails.
- Parallel Jobs using multiple pods with a Work Queue.
Scenarios 1 and 2 above are simple. However, scenario 3 is more complex due to inter-dependencies among pods. For example, in scenario 3, a set of pods might perform a sequence of operations. Each pod performs unique tasks, but the input must be produced first by another set of pods; therefore, synchronization is required between the pods. However, Kubernetes doesn’t provide these pod synchronization mechanisms, so these inter-dependencies among pods must be handled outside Kubernetes control.
This problem is really an opportunity to use other technologies designed for queue-based processing like Kafka consumers or with a temporary data storage like Redis. Through this article, we’ll explore the use of this latter example as a queue, which we can populate with data our application needs to process, and use Kubernetes functions to orchestrate those processes efficiently.
How to Deploy Jobs on DigitalOcean Kubernetes Cluster
Let’s look at how to deploy jobs on a Kubernetes Cluster on DigitalOcean. To showcase a simple Job execution scenario, let’s use the pi calculation standard example job.yaml file.
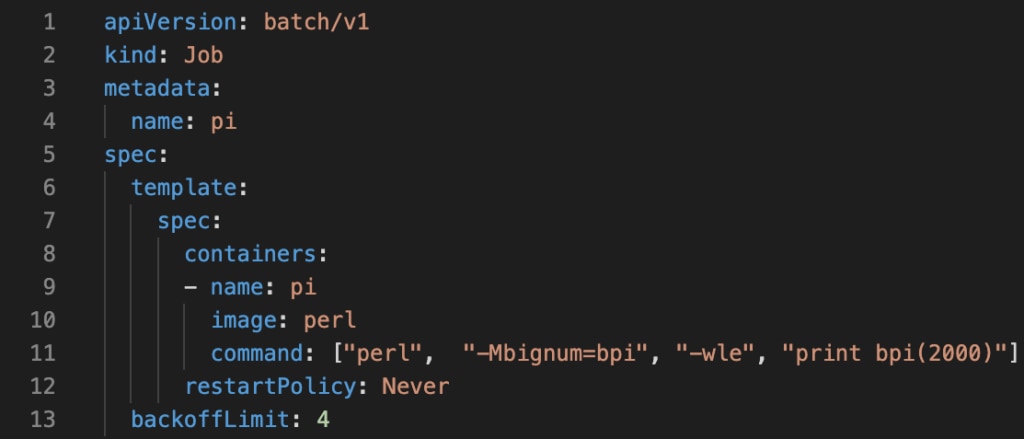
To deploy the calculation as a job, issue the following command:
$ kubectl apply -f https://kubernetes.io/examples/controllers/job.yamlIf successful, you’ll see the following:
job.batch/pi createdThe job will also appear in the Kubernetes Dashboard.
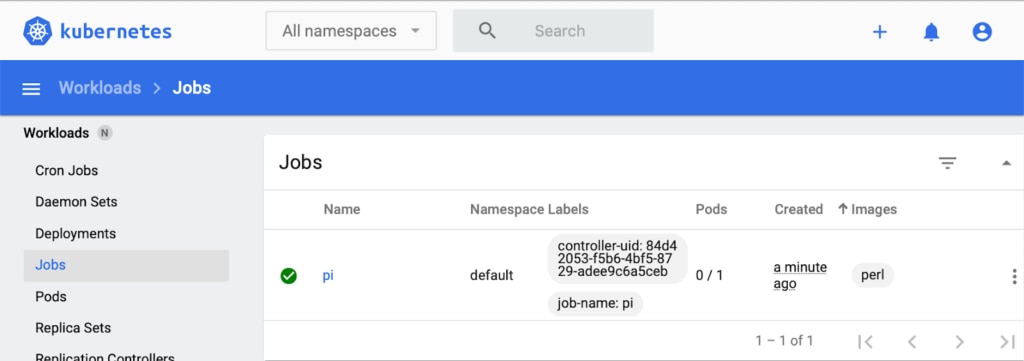
You can issue the following command to see the status of our Job.
$ kubectl describe jobs/piThis will print a detailed description of the Job according to Kubernetes specifications. If you plan to delete the Kubernetes Job created above, then issue the following command. It will also remove allocated pods.
$ kubectl delete -n default job piDebugging a Complex Parallel Job Using Work Queue
While it’s relatively easy to resolve issues related to single-run Kubernetes Jobs, when complex, dependent Jobs fail, debugging becomes much more difficult. And because complex jobs that fail don’t automatically release allocated resources, small failures can turn serious, fast.
So how do you debug your jobs when you have a swarm of containers? You need deeper visibility into these Jobs to understand why the specific Job is not releasing allocated resources. Traditionally, you might try this:
$ kubectl logs -l job-name=pi --max-log-requests=50 --timestamps --prefixHowever, this built-in functionality simply prints limited logs, which doesn’t help much. Instead, we need to use advanced log management tools to help us perform a true root cause analysis of the problem amongst all our ephemeral infrastructure in a single view.
SolarWinds Papertrail
SolarWinds Papertrail is an affordable, cloud-hosted, enterprise-grade log management service designed to help DevOps engineers gather, filter, analyze, and report infrastructure and application issues. It captures critical diagnostic information for faster problem-solving. Combined with DigitalOcean, it gives you the perfect solution for monitoring your Kubernetes Work Queues.
Let’s look at how to set up Papertrail.
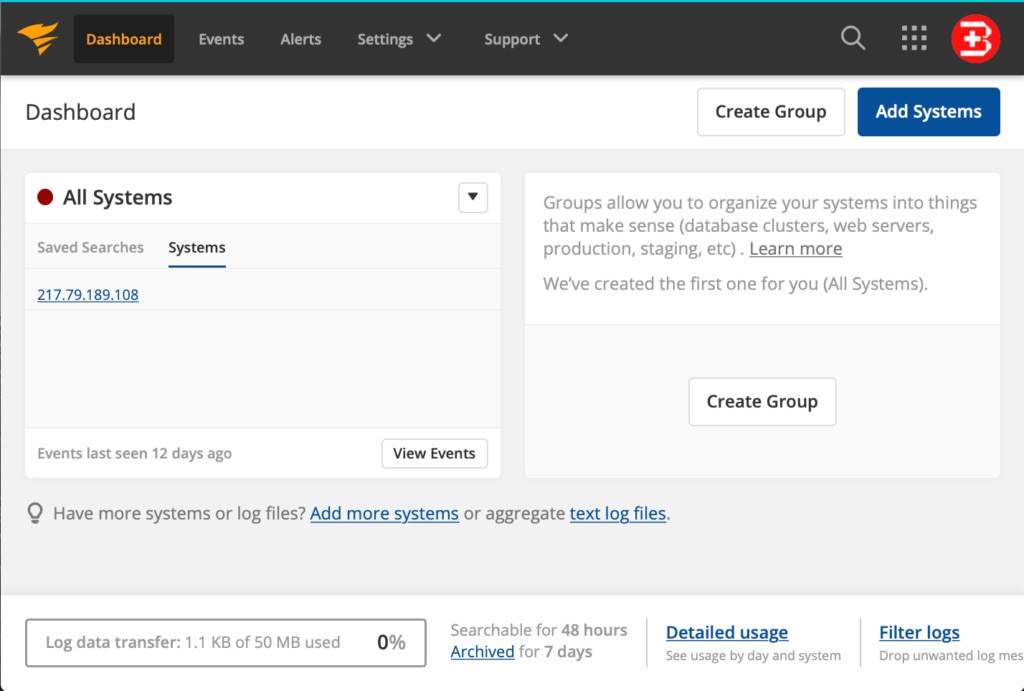
To start looking into your system logs, you first need to do one of the following:
- Add some systems (using Add Systems button on the top-right side shown above). This sends logging information to the cloud-hosted Papertrail service, and
- Integrates log collectors using connectors
- Configures triggers, alerts, and notifications.
- Or upload logging data directly into the cloud-hosted Papertrail service
- from file archives, such as AWS S3 buckets.
It’s easy to connect your logging source to the Papertrail service. For example, I opened a Terminal window on my MacBook Pro and issued the following commands:
$ ls -d /etc/*syslog*
/etc/newsyslog.conf /etc/syslog.conf
/etc/newsyslog.d /etc/syslog.conf~previous
Using the following command, I opened the syslog.conf file to edit
$ sudo vi /etc/syslog.confand added the following line at the end of syslog.conf file:
*.* @logs9.papertrailapp.com:43210Please note the cloud-hosted Papertrail service instance name is logs9 and the port number is 43210. These values are specific to my instance, but you can retrieve your values by clicking on the Add Systems button in the Papertrail Dashboard. You’ll see this message during setup:
Your logs will go to logs9.papertrailapp.com:43210 and appear in Events.Then, issue the following command to activate logging into the cloud-hosted Papertrail service:
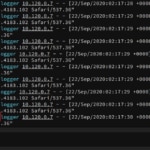
$ sudo pkill syslogdI started to see the following data in the Event Viewer within a few seconds:
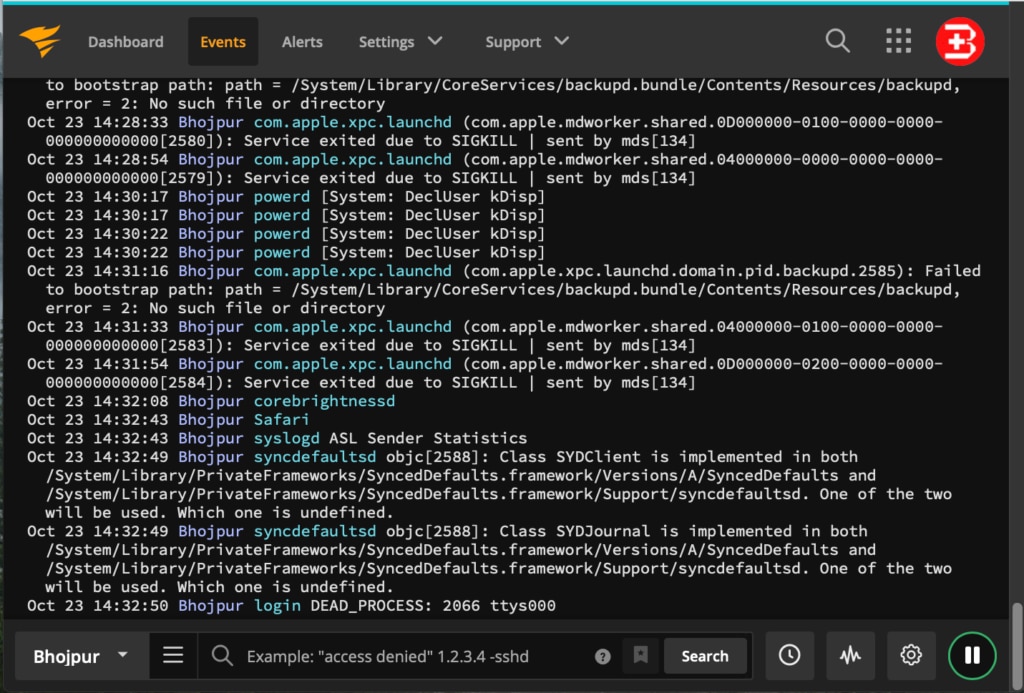
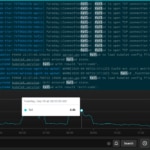
With logs now flowing into Papertrail, in near real-time, I can start searching and filtering event messages. Using the Google-like search bar, you can search for events using keywords, Boolean operators, or event plain text. The play and pause button on the bottom right corner switches between searching the live stream of events and historical events. The clock icon on the bottom bar filters and applies event searches within a specific time frame.
Conclusion
To summarize, we created a Kubernetes cluster on DigitalOcean and a work queue. We explored some of the debugging challenges posed by complex parallel job which illustrated how an advanced log management solution could be useful for this type of debugging. For additional log management capabilities, we setup Papertrail and created a log destination. With a few commands, we saw event messages streaming into the Papertrail event viewer.
Check back for part two of this series, where we’ll pick up from here and explore the different approaches to Kubernetes logging supported by Papertrail. We’ll walk through debugging a work queue and specifically how to use Papertrail to accelerate troubleshooting these types of issues. We’ll close with a few pointers on what to look out for when working with work queues in Kubernetes.