TLDR Summary: How Papertrail integrates with Heroku to extend and improve Heroku’s native logging. Heroku aggregates application, system, and add‑on logs into a single stream using Logplex, which is accessible via the Heroku CLI but has retention and volume limits (logs are buffered for a short time and can be dropped during high‑volume events like crashes). Writing logs to disk isn’t reliable on Heroku because dyno filesystems are ephemeral.
SolarWinds® Papertrail™ has supported Heroku almost from the beginning, as an add-on in the Heroku Marketplace and as a compatible standalone log management tool. Heroku’s focus on empowering developers to build and deliver applications by providing an easy-to-use platform as a service fits perfectly with the vision of Papertrail.
Both developer-focused technologies can be set up typically in minutes, are easy to use, and offer powerful functions. It’s not a surprise the Heroku and Papertrail relationship has lasted so long and been such a success.
This momentous milestone seems like a good time to review how Heroku handles logs and how Papertrail complements and extends native Heroku logging capabilities.
Logging in Heroku
Like other platform as a service (PaaS) providers, the Heroku platform manages the infrastructure and development environment. Heroku also makes add-on components like monitoring, analytics, and data storage for developers to add to their Heroku environment to support their applications. All these systems and services generate log messages. For example, a single application on Heroku can generate build logs, system logs, runtime logs, API logs, add-on logs, and application logs.
Viewing the logs of an application hosted in Heroku is straightforward using the Heroku command line interface (CLI) and heroku logs command.
To enable centralized viewing of log messages, Heroku manages log messages as streams. It aggregates systems, API, and application logs sent via STDOOUT or STDERR. Logs are directed into a single channel accessible and viewable from the Heroku CLI. The Heroku service that directs logs into a consolidated channel is called Logplex.
Logplex
Logplex is a distributed syslog router designed to merge and redistribute multiple incoming syslog streams. A typical Logplex setup is a cluster of Erlang nodes connected in a mesh with one or more Redis instances that can be partitioned or sharded. Logplex reads syslog messages from TCP and HTTP(s) streams on any node in the cluster. Each node in the cluster can store log messages for up to one week in Redis buffers—a combined total of up to 1500. Heroku makes Logplex available as an open-source project, so you can access log messages through the Heroku command line tool and through the public API.
When dealing with log messages, the log volume can go from a trickle to a flood in seconds. For example, when an application crashes, it can generate 50,000 lines of stack traces in a heartbeat. This type of volume can overwhelm the 1500 line Redis buffer, and you can end up losing log data when you need it the most. This is where add-on logging services come in.
Logging Add-On Services
Managing logs from applications on Heroku can be tricky. The first thing to consider is how to manage the Heroku default 1500-log-line limitation and the maximum storage limit of one week. Writing logs to a local file isn’t a great option either since the Heroku file system is ephemeral, and each time a “dyno” cycles, you lose log data.
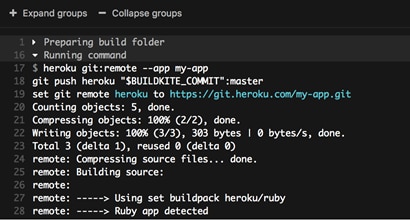
This is where logging add-ons like Papertrail come in. When you add Papertrail to your Heroku environment, Papertrail automatically creates a log drain as part of the installation. The Logplex service routes log messages to the log drain, which will then POST log messages to an HTTP endpoint for ingestion by Papertrail. Using the Papertrail add-on addresses both the log message storage and retention limitations.
Papertrail Complements the Heroku Logplex Service
Using Papertrail to manage and monitor logs from applications running in Heroku provides more than just more log storage for a longer time. Papertrail simplifies searching and working with Heroku logs. With Papertrail, you can view and search log messages in real time, set up alerts, and save and share searches from the search bar. You can see events in context across the interconnected systems in Heroku and use the log velocity analytics to troubleshoot issues more quickly.
Flexible Log Viewing and Searching
Papertrail provides two user interface options for viewing and searching log messages. If you’re more comfortable using a command prompt, you can use the Papertrail CLI to retrieve, search, and tail logs.
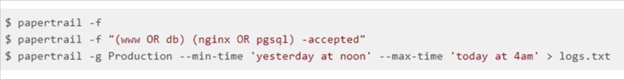
The Papertrail command line client offers several search and tail options beyond standard Heroku log commands of heroku log and heroku logs –tail. Below are some of the commands the Papertrail CLI supports.
papertrail - command-line tail and search for Papertrail log management service
    -h, --help                       Show usage
    -f, --follow                     Continue running and printing new events (off)
        --min-time MIN               Earliest time to search from
        --max-time MAX               Latest time to search from
    -d, --delay SECONDS              Delay between refresh (2)
    -c, --configfile PATH            Path to config (~/.papertrail.yml)
    -g, --group GROUP                Group to search
    -S, --search SEARCH              Saved search to search
    -s, --system SYSTEM              System to search
    -j, --json                       Output raw JSON data (off)
        --color [program|system|all|off]
                                     Attribute(s) to colorize based on (program)
        --force-color                Force use of ANSI color characters even on non-tty outputs (off)
    -V, --version                    Display the version and exit

  Usage:
    papertrail [-f] [--min-time time] [--max-time time] [-g group] [-S search]
      [-s system] [-d seconds] [-c papertrail.yml] [-j] [--color attributes]
      [--force-color] [--] [query]
For a complete list, check out the readme.md file on GitHub.
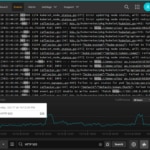
For wider functionality and more customization options, you can use the Papertrail web application to search and tail Heroku logs. The recently re-designed event viewer lets you choose between different color themes, fonts, and line spacing options to tailor your log searching experience.
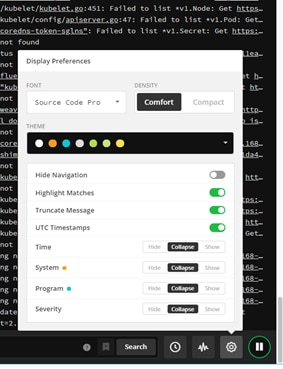
You can choose to hide, collapse, or show different log elements like Time, System, Program, and Severity and toggle highlight search matches and UTC timestamps on and off. Selecting a log line allows you to show an event in context, and actionable links in each log message allow you to drill down quickly. These features combine to give you more control over your log searching experience.
Everything at Your Fingertips
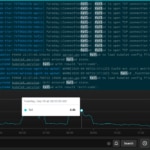
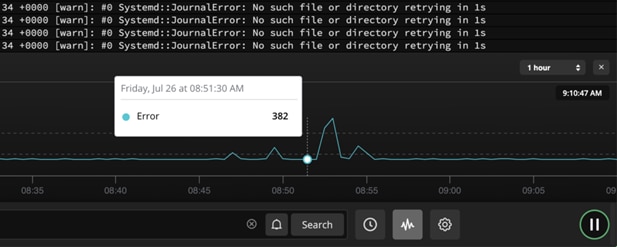
You can do almost everything right from the search bar. You can select different log sources, save searches, and create alerts. Using the controls to the right of the search bar, you can jump to log messages from a specific day or time or view, search, and pause live log streams. You can visualize the log message volume, select a point on the graph, and view the underlying events. Everything you need is in one interface.
Papertrail Setup Options
You can view, search, and manage logs from Heroku applications using the Heroku add-on or a standalone Papertrail account. Both options will capture log messages from Heroku routers, applications, dynos, platforms, and Heroku Postgres senders. Some situations and environments might lend themselves better to one installation option.
Papertrail Heroku Add-On
The Papertrail Heroku add-on is a one-step installation that uses the payment method you set up in Heroku and provides access to Papertrail to the same collaborators you defined for your application in Heroku. Using this installation method, the Heroku log drain is set up automatically. Papertrail will also create three named searches automatically:
- Heroku Platform Errors
- Heroku Scheduler Jobs
- Dyno State Changes
- Web App Output
The Papertrail Heroku add-on is a good installation option if you have an application on Heroku and want to try out Papertrail. It’s also a great choice if all the applications or systems you want to monitor are on the Heroku platform. For more information or to activate it, go to elements.heroku.com.
Standalone Papertrail Account
The other installation option is a standalone Papertrail account, which can receive logs from Heroku apps and applications and sources outside of Heroku. The setup is a bit more than a single click, but still quick and painless. You’ll need to set up a Heroku log drain, name your Heroku application(s), and create the named searches. Once setup is complete, you can monitor and manage logs from your Heroku apps alongside logs from other sources. It’s perfect if you plan to use Heroku while you build and optimize your application but are looking to private or multi-cloud environments for production.
Detailed setup instructions walk you through setting up a standalone Papertrail account to work with Heroku. There are three steps:
- Set Up the Heroku Log Drain
You first need to identify your hostname and port, which are in the log destinations screen. Once you have those, enter the following into the Heroku CLI, substituting logsN and XXXXX with the hostname and port:
$ heroku drains:add syslog+tls://logsN.papertrailapp.com:XXXXX2. Name the Heroku Application(s)
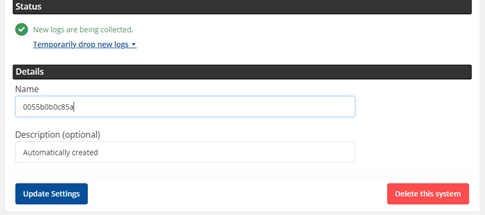
One the Heroku application logs start flowing into Papertrail, you’ll notice log source will be attributed to an eight-digit number. This number is a Heroku-generated GUID. To change the log source name to something more descriptive, open the Papertrail Dashboard, select “All Systems,” find the Heroku drain, and select “edit” to enter a name and description.
3. Add Heroku Searches
To add the default Heroku searches, you can copy and paste the following in the Heroku CLI, where you replace YOUR_TOKEN with your API token
$ curl -G -v -H "X-Papertrail-Token: YOUR_TOKEN" -X POST https://papertrailapp.com/api/v1/searches.json --data-urlencode 'search[name]=Platform errors'
--data-urlencode 'search[query]="error code=H" OR "Error R" OR "Error L"'
$ curl -G -v -H "X-Papertrail-Token: YOUR_TOKEN" -X POST https://papertrailapp.com/api/v1/searches.json --data-urlencode 'search[name]=Deploys' --data-urlencode 'search[query]=program:app/api -scheduler'
$ curl -G -v -H "X-Papertrail-Token: YOUR_TOKEN" -X POST https://papertrailapp.com/api/v1/searches.json --data-urlencode 'search[name]=Scheduler jobs' --data-urlencode 'search[query]=program:scheduler'
$ curl -G -v -H "X-Papertrail-Token: YOUR_TOKEN" -X POST https://papertrailapp.com/api/v1/searches.json --data-urlencode 'search[name]=Dyno state changes' --data-urlencode 'search[query]=web (Idling OR Unidling OR Cycling OR "State changed" OR "Starting process")'
$ curl -G -v -H "X-Papertrail-Token: YOUR_TOKEN" -X POST https://papertrailapp.com/api/v1/searches.json --data-urlencode 'search[name]=Web app output' --data-urlencode 'search[query]="app/web"'
There’s much more you can do to customize your standalone Papertrail account for Heroku applications. Check out the documentation for details.
Here’s to Another 10 Years Together
Heroku is a great platform for developers. It’s easy to use, supports eight common programming languages, and offers a wide array of add-on tools. Papertrail, which is also easy to use and supports a wide variety of log types, is the perfect Heroku logging add-on. Together they can create a frustration-free dev experience.
For more articles on using Papertrail with Heroku, check these out: