Serverless architectures such as AWS Lambda have created new challenges in debugging code. Without a solid logging framework in place, you could waste precious hours tracking down simple defects in your functions. A strategic logging framework can be a powerful way to track down and resolve bugs.
Let’s walk through how to get the most out of logging Lambda functions. We’ll set up and troubleshoot code to find the root cause of a defect, look at some best practices for logging Lambda functions, and explore setting up alerts.
Logging is Essential for Serverless Functions
Many developers consider logging to be an afterthought or a ‘nice to have’. You’d push your code to production and wait. When something went wrong, you’d launch your debugger, step through your code, and track down the issue.
Now, however, with serverless architectures such as Lambda functions, stepping through code is not a simple task. Therefore, it’s essential to create a logging strategy before your defects happen. Otherwise, you might find yourself scrambling for endless hours, trying to figure out why your code keeps failing.
You Need More Than AWS CloudWatch
AWS has built-in logging for Lambda functions called CloudWatch that works for basic purposes. Recent updates, such as CloudWatch Analytics, have made the product more useful. Anything you send to console.log() in your function will be sent to CloudWatch and visible through the AWS console.
However, a log management tool like SolarWinds® Papertrail™ gives you features CloudWatch doesn’t support, such as live tail mode (viewing logs in real time), aggregation of logs across all your services, platforms, and providers, and the ability for you (or your whole team) to monitor your logs without living in the AWS console.
Using Papertrail with AWS
Let’s set up a logging example in an AWS Lambda function using Papertrail. We have two choices on how to send our logs to Papertrail: we can log to Papertrail straight from our function using the Winston-Papertrail JavaScript library, or we can create a second Lambda function that pulls the logs from CloudWatch and sends them to Papertrail.
For our example, we’re going to use the PaperWatch tool to create a second Lambda function to transfer our logs from CloudWatch to Papertrail. We won’t cover the details here, but you can do this yourself by following these detailed instructions in the Papertrail documentation.
Logging and Debugging a Lambda Function
Let’s take a look at our Lambda function. Our function is written in Node.js and retrieves the latest price of Bitcoin.
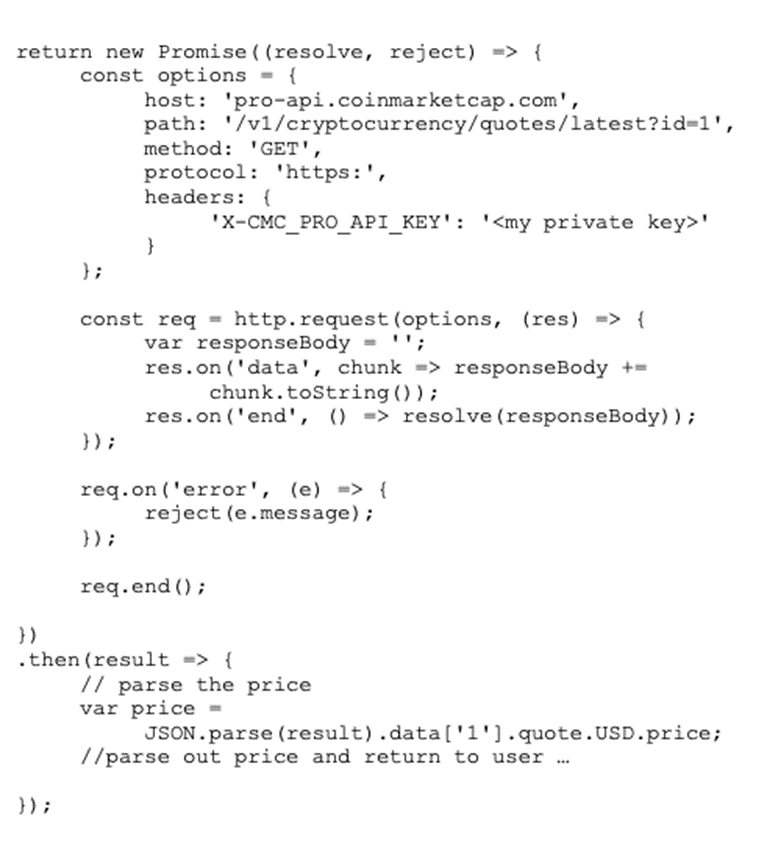
As you can see, our function calls an external API (coinmarketcap.com) to get the latest information on bitcoin (which has an ID of 1). Our function then parses the response to get the price and returns the price to the user.
This is relatively simple code, and it works well when we test it. We go ahead and deploy this code to production, and for the first few weeks, there aren’t any issues. Several weeks later, the price of Bitcoin increases, and our function becomes instantly popular. Suddenly, our users start receiving intermittent errors and our function has stopped working. Worst of all, it’s failing silently and seemingly randomly for no obvious reason. People are complaining, and we need to get our function working again.
A little logging in our function will go a long way towards debugging our issue. Let’s add in the log statements we should have added before we went live.
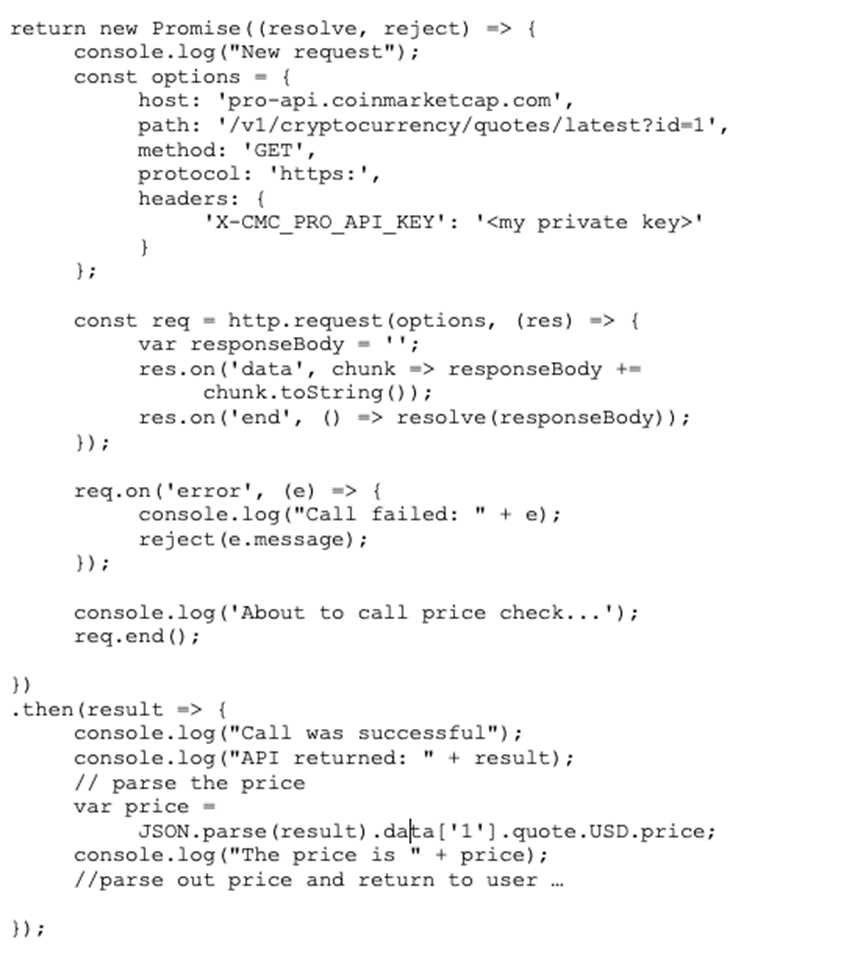
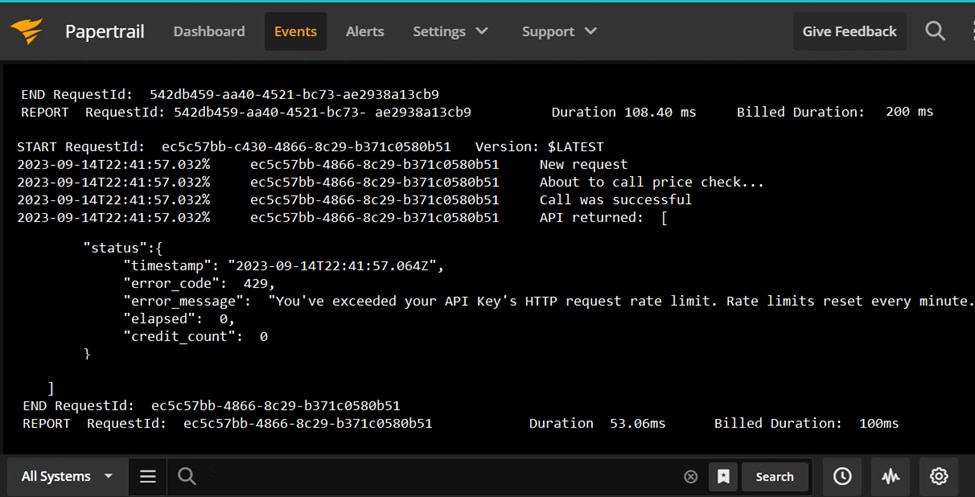
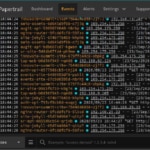
Thanks to the logs, the issue is now obvious. The external function we’re calling is rate-limited, and we’ve hit our free, unpaid limit. There are too many calls happening too fast. And since we didn’t write code to handle the case of the external call failing, the function is failing.
This would have been an especially difficult defect to track down since the conditions for failure (heavy load) most likely only exist in production, and the rate-limit resets every sixty seconds. But with the appropriate log statements and with the ability to see the logs in real time as users call our function, finding and addressing the issue is quick and easy.
Proactively Monitor with Papertrail Alerts
For a more robust function, our next steps would be to pay for our access so the rate limits are removed and to add a check for the various response codes our external call might return to enable us to handle the errors appropriately. But while we’re in Papertrail, let’s go ahead and set up an alert so if a rate call limit happens again, we’ll get an email.
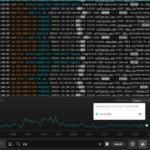
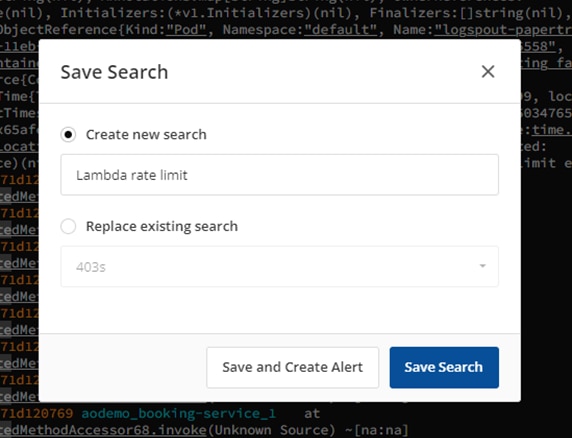
Setting up an alert in Papertrail is easy. We simply search for the type of log entry we want to trigger the alert, then save the search using “Save & Setup an Alert.”
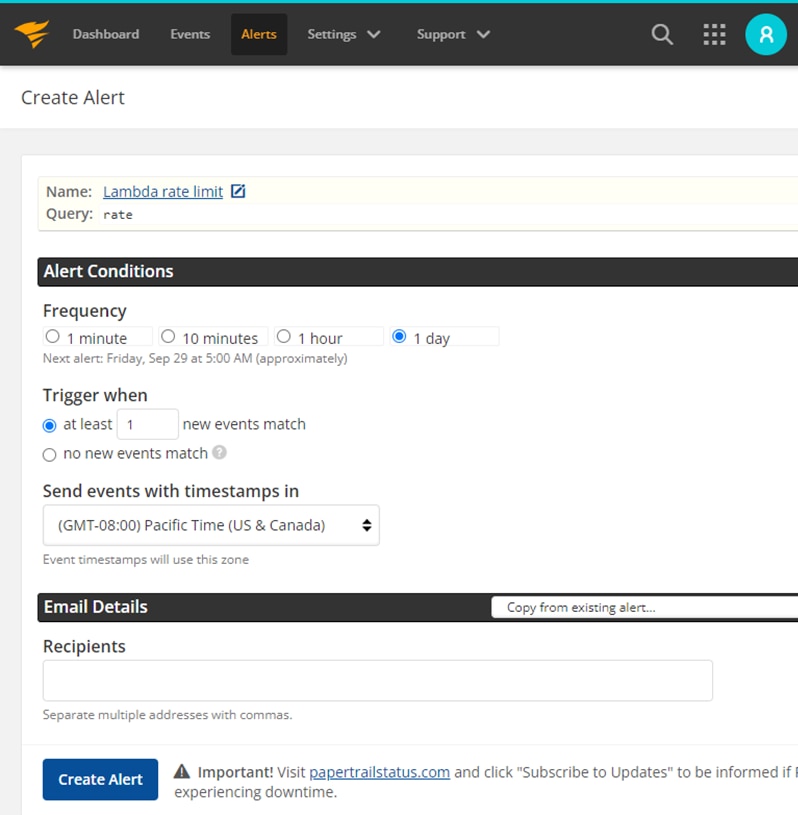
Now we enter the details of our alert and save.
Wrapping up
Setting up logging with AWS and Papertrail is simple, but very important. Logging is easy to take for granted until something goes wrong. Without the logging in place, we’d have spent a long time trying to figure out why our function was failing. Papertrail allowed us to not only see the logs easily, but to see that failure in real time, allowing us to quickly debug, fix, and redeploy.
To see Papertrail for yourself, sign up for a 30-day free trial and start aggregating and searching logs from all your AWS apps.
A Proactive Approach to Troubleshooting
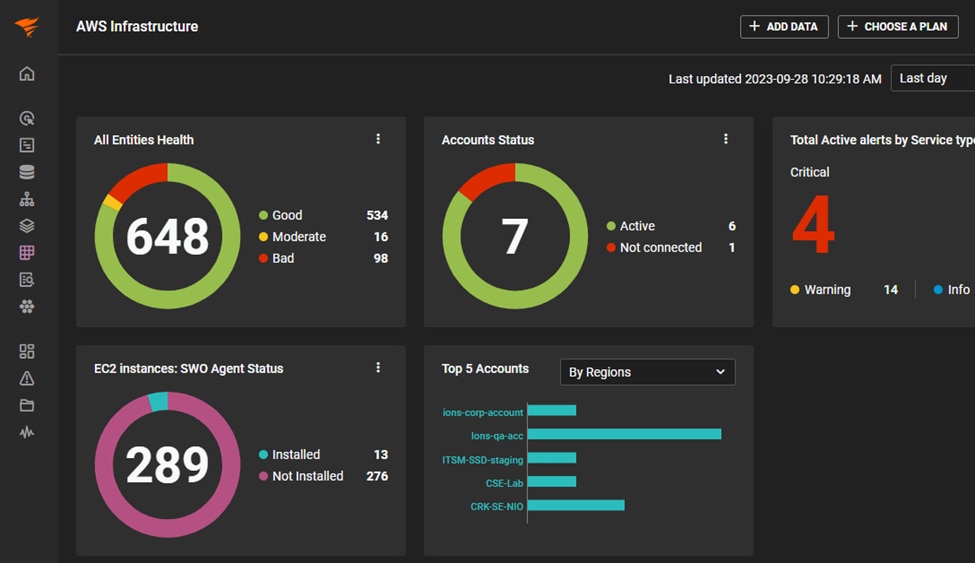
If you want to identify emerging issues and not wait for an alert, you should consider an observability solution like SolarWinds Observability SaaS which provides visibility across the technology stack and incorporates AIOps enhanced with machine learning intelligence to bring focus to business-impacting issues. SolarWinds Observability SaaS offers compelling visualizations that communicate response times, throughput, and errors at a glance, and from there, you can immediately drill down into a filtered view of the log events and view the events in context.
If you are curious about what an observability solution can do, try the interactive demo or sign up for a free trial.
Want to dig deeper? Explore the latest insights from the Gartner® Magic Quadrant™ for Observability Platforms by clicking here.