Microservice architectures are everywhere these days. Even internal enterprise applications—which have typically been structured as self-contained monoliths—are now being designed using a microservices architecture.
There are definite advantages to a microservices architecture. Breaking an application into discrete, independent chunks—basically mini apps—gives you enormous flexibility. But this flexibility dramatically increases complexity, especially when things go wrong.
“Something Went Wrong” System Errors
In a traditional application, if there’s an exception, you can enable debug logging, recreate the error condition, and—using a nifty tool like SolarWinds® Papertrail™—tail and search events until you identify the cause of the issue.
With applications built on microservices, a single request can traverse multiple independent microservices, each consisting of numerous independent and ephemeral services. This means you lose end-to-end visibility over the request. Your users may see a “something went wrong” message, and you may have no idea which service failed and even less understanding of why.
To troubleshoot errors like these in a microservices application, you need to be able to correlate multiple isolated events across different services as part of a single transaction. This is where distributed tracing comes in.
Enter Distributed Tracing
Distributed tracing lets you track a single transaction—a user generated request, for example—as it traverses through the numerous interdependent services making up the application. Distributed tracing lets you walk a request from start to end and spot failures. But instead of tracking the path within a single application, distributed tracing follows the request across the interconnected services.
For example, say a customer makes a request to book a hotel room on a website, and the application updates the booking information and calls the payment application. Since the request spans multiple resources, distributed tracing follows the request across all the services, APIs, and resources with which it interacts.
Focus on Important Events
To see how distributed tracing can help, let’s look at the annoying “something went wrong” message in the hotel booking application I mentioned earlier. Let’s say the call to support came in around 8 p.m. on a Sunday. When I open the Papertrail event viewer and look at the events around 8pm, I can see an increase in log volume.
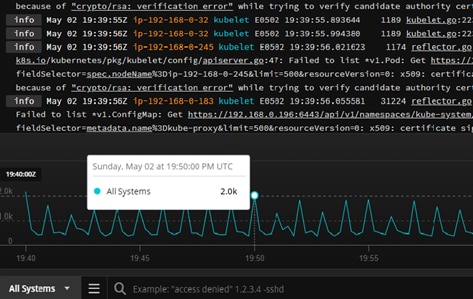
But when I load the events in this time frame, I still have more than 2,000 event messages to crawl through. With nothing more to go on than the error message and time stamp, it’s difficult to identify the cause of the problem. This is where distributed tracing comes in handy. With a trace ID, Papertrail can zoom in on all the events in a specific transaction, simplifying troubleshooting.
To make this work, the system generates a unique identifier when the request is received, and this ID is passed to each service. You can instrument this manually, but an easier way is to look at an application performance management (APM) tool like SolarWinds AppOptics™.
AppOptics libraries use auto-instrumentation and context propagation through HTTP headers. These headers include the trace ID, which is passed through to the logs. This allows you to use them to isolate events related to a request in Papertrail.
A Different Approach to Troubleshooting
With an APM tool like SolarWinds AppOptics, you can take most of the guesswork out of troubleshooting and start focusing on relevant events. In our example, instead of immediately opening Papertrail and combing through screens of logs and matching time stamps, you can first open AppOptics and visually explore response time, performance, and errors around a specific time.
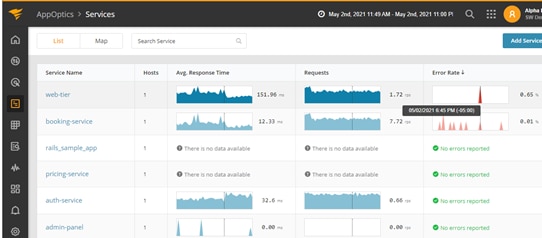
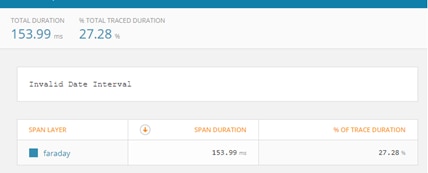
If you see an error like the one in the screen above, you can drill into a trace for more details. The trace view provides a visual breakdown of a trace and shows you the duration of each span.
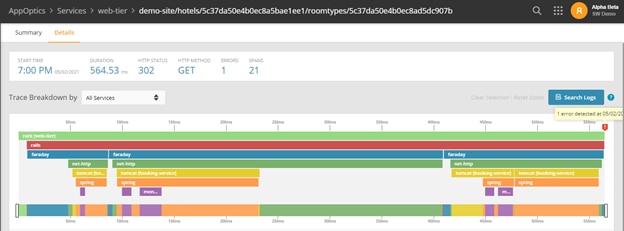
The root cause summary AppOptics provides is also much more meaningful than “something went wrong.”
Follow the Trace to the Logs
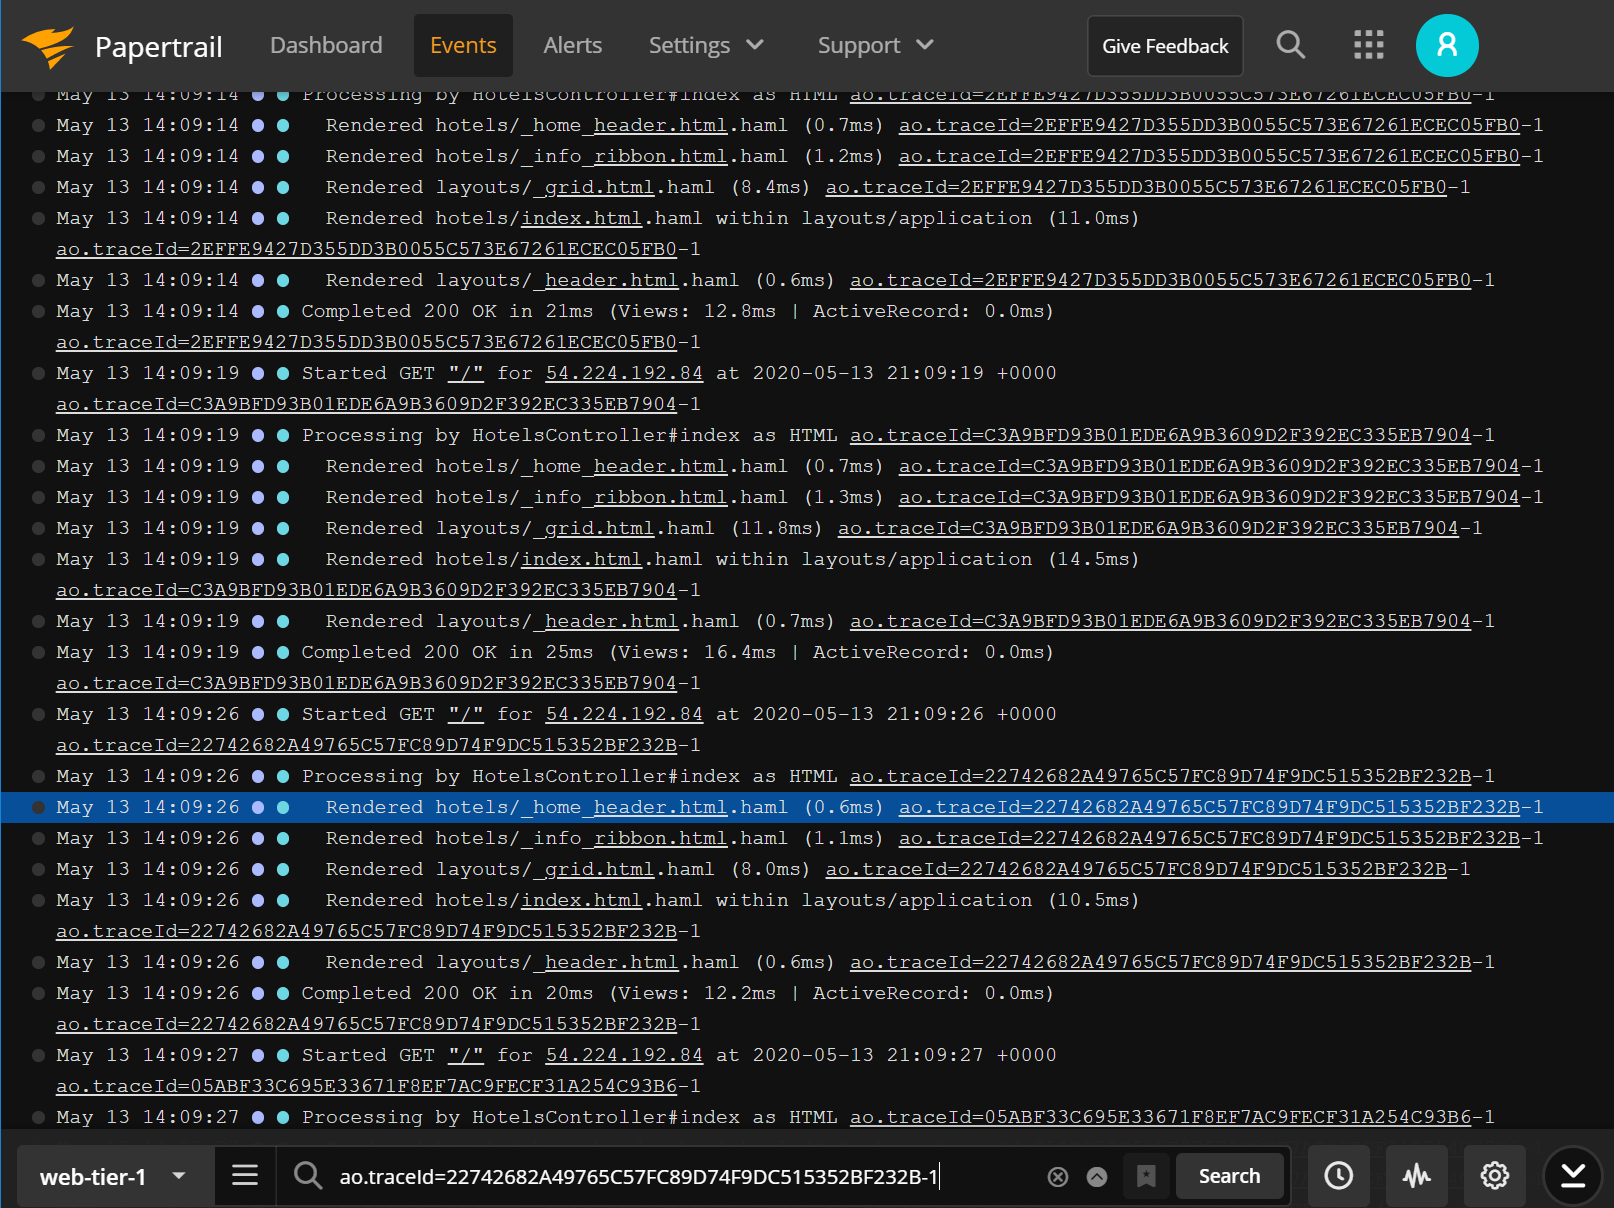
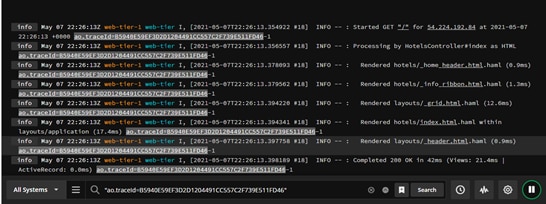
If you integrate AppOptics with Papertrail, you can jump from the trace view into the logs by selecting Search Logs. The ao.traceID is embedded in all the log lines created from any of the services involved in the transaction. With one click, the Papertrail event viewer launches and a filter matching the trace ID is applied.
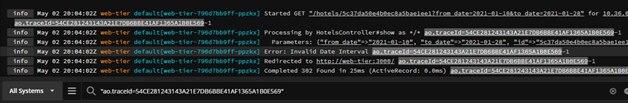
You can see all the logs associated with the request, even as it crosses multiple services. You see the events leading up to an error and can put the error in context.
Wrapping Up
Pairing an APM tool like AppOptics with Papertrail can simplify troubleshooting applications built on microservices by allowing you to track a single request as it traverses through multiple services. You can also use time series metrics, distributed traces, and the associated logs to pinpoint the root cause of performance problems.
Additionally, AppOptics offers performance monitoring for infrastructure (servers, virtual hosts, and containers) and applications and the ability to define custom metrics if the 150+ out-of-the-box integrations aren’t enough. If you’re curious about the tool, you can test drive AppOptics with a free trial and see how much easier troubleshooting can be.