When your infrastructure doesn’t offer the scalability to add hardware and applications without huge monetary investments, you can turn to cloud hosting. Microsoft Azure caters to businesses with mainly Windows environments and hosting can be difficult to monitor as you scale up resources. As you add more VMs and applications to your cloud, you may struggle to keep track of logs across the entire network. Every time you create a new VM, upload a new application, develop a new website, build a new database, or any other new resource, Azure produces a variety of logs stored in different locations. This can make it difficult to find the necessary information for monitoring your services or troubleshooting problems.
Later, we’ll show you how, with Papertrail™, you can stream your application logs directly to a central location. Its aggregated Event Viewer offers targeted monitoring, searches, and live tail functionality.
The Many Types of Azure Logs
Azure creates a number of logs depending on the resource you make. When you develop a new database, for instance, Azure generates activity and diagnostic logs that monitor changes you make from your Azure portal. You can read more about monitoring and logging activities in Azure here.
Additionally, with every installation of Windows, Event Viewer is included in the operating system to monitor events. Failed logins, security changes, system changes, and application events can be reviewed in Event Viewer. Whenever you host a website or deploy a .NET application to Azure, you have application logs you need to monitor. Monitoring logs from just one application doesn’t require much effort, but when you accumulate dozens across a variety of applications, Papertrail can help you aggregate and stream them to one centralized location.
Azure Log Analysis Tools
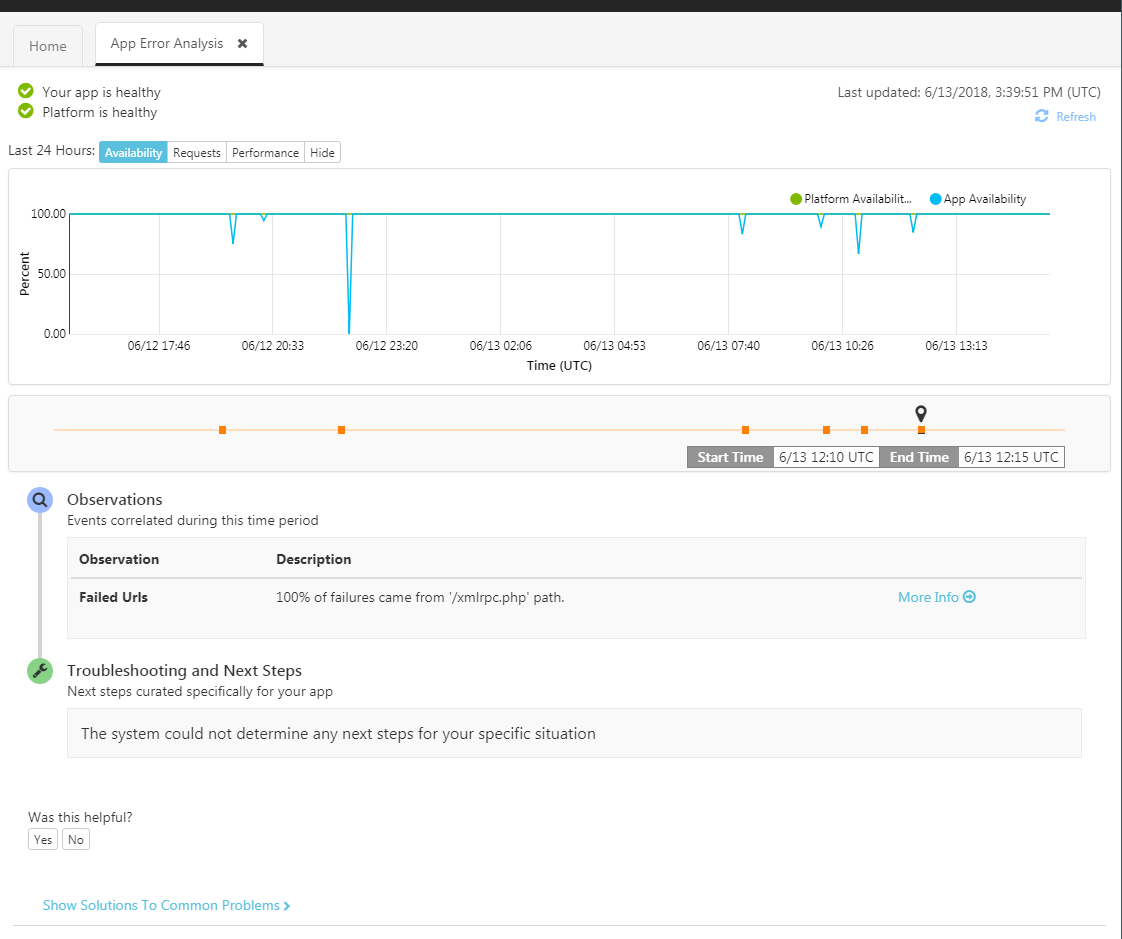
When you’re creating an application in Azure, Azure produces activity logs and makes a diagnostic interface available for review from your Azure portal in the Activity Log section of the resource group. The activity log interface provides a general overview of errors and data activity, such as the number of errors.
 (© 2018 Microsoft Corporation. All rights reserved.)
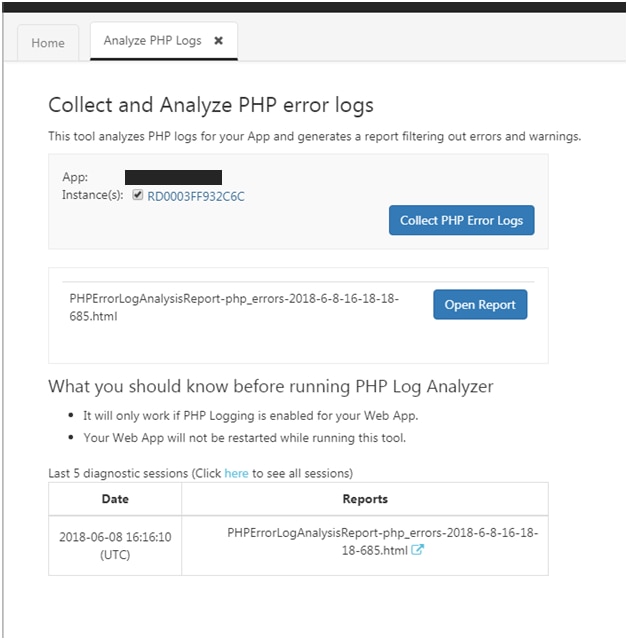
Azure has a number of log reports and diagnostic tools, including a PHP log analyzer that can generate a report of errors.
(© 2018 Microsoft Corporation. All rights reserved.)
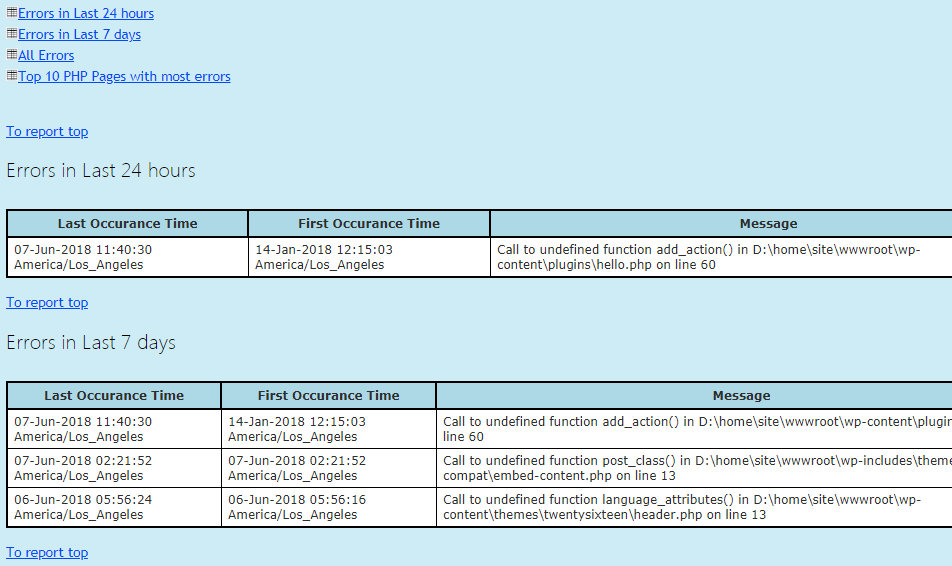
The output for the diagnostic report looks like the following:
(© 2018 Microsoft Corporation. All rights reserved.)
The diagnostic report displays a list of errors and includes the time the errors occurred and the message.
Using Kudu to Access Logs
Azure has a number of resources that let you download files, and several ways to view Azure log files and migrate them. These files are stored as blobs due to their large amount of data.
Azure includes an application called Kudu that lets you view files in your browser. Kudu is available in the “Advanced Tools” section of your application resource group.
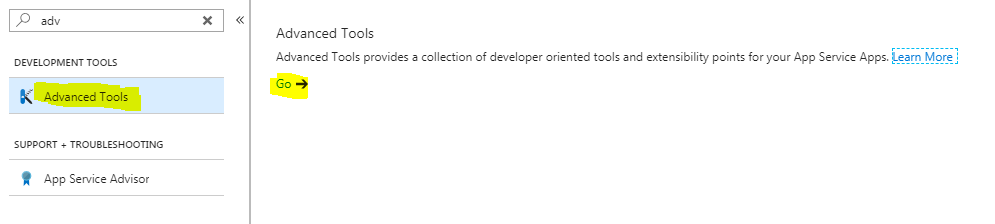
(Kudu© is listed as an Advanced Tool in the application resource group)
(Kudu© is listed as an Advanced Tool in the application resource group)
Click the CMD menu option in the Debug Console.
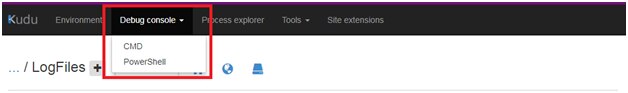
(Kudu© menu options)
You then get a list of your files.
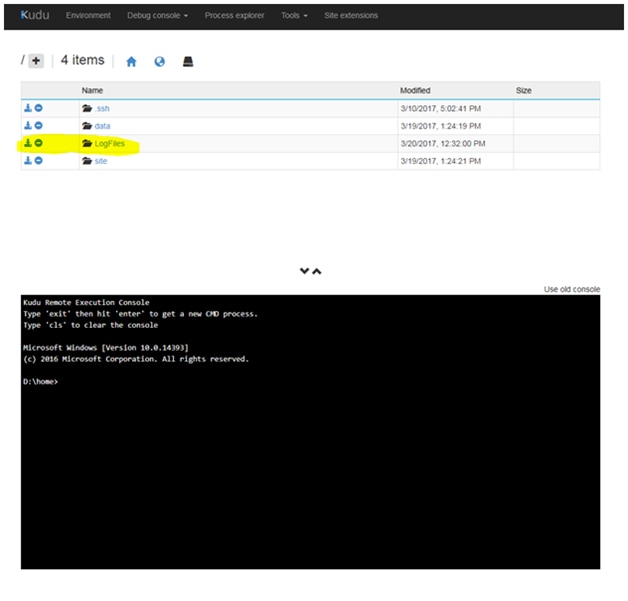 (Kudu© file list)
Log files are located in the LogFiles directory.
Note: For a quick shortcut to Kudu, just type the following into your browser:
http://<yoursitename>.scm.azurewebsites.net
Kudu is great to get an idea of how many files you need to export and their sizes, but it’s clunky for file transfers. You can download your log files one by one from this interface, but you probably have several blobs you want to export.
Microsoft provides Azure customers with several options for managing files. Azure Storage Explorer gives you an Explorer-looking interface to view and manage files. AzCopy is a command-line utility which lets you move a file from an Azure storage location to your local drive or another HTTP directory.
Papertrail Logging Analytics Extends What Azure Offers
With the Papertrail solution, you can aggregate events straight to one location, then graph, search, monitor, and identify errors within your applications. The screenshot below shows a search based on the virtual machine name. This is useful if you want to view events only from a specific Azure service. Leaving the search phrase in the text box will show events only from that particular VM. The benefit is that if you know you have a certain VM acting up, you can filter out any noise from other applications and servers and focus on the VM giving you problems.
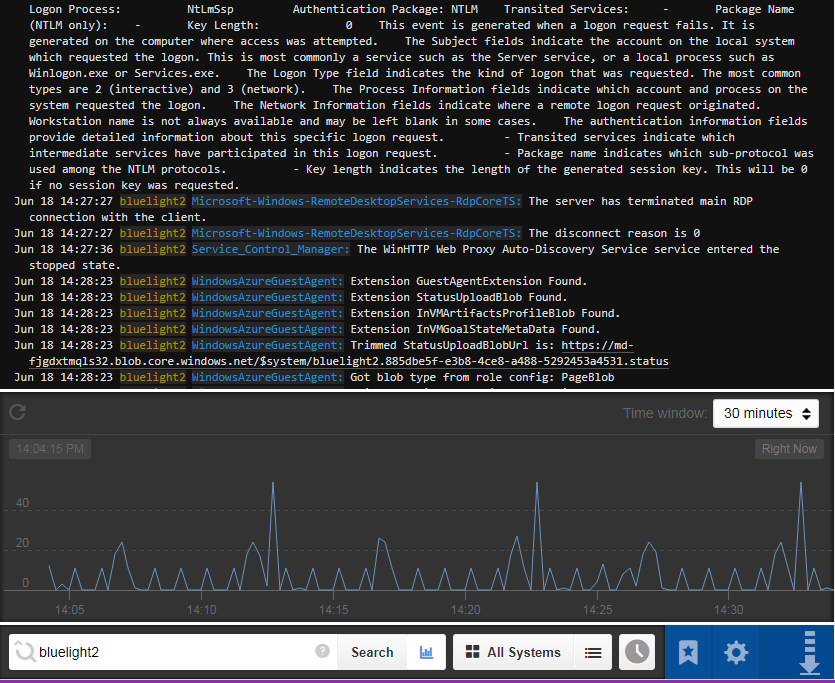
(The Papertrail Event Viewer search with associated graph)
Another benefit is graphing directly from the Papertrail Event Viewer. For instance, suppose you want to know the number of events logged on your VM within the last 30 minutes. Just click the “Graph” icon  next to your search and choose the time window in the top-right corner of the graphing section. Papertrail shows you an interactive graph with your logged events based on your search.
Send Application and Windows Event Logs to Papertrail
Enterprise organizations usually have several Azure applications spanning multiple resource groups in Azure. With Papertrail and NXLog, you can aggregate logs across multiple resource groups. Just connect your Windows event logs to the Papertrail service using the free NXLog agent. NXLog monitors the Windows event log, so any operational or application events logged to your Windows event log are passed to Papertrail.
The first step is to configure NXLog on your virtual server. Don’t forget to restart the NXLog service after you’ve installed it to start pushing logs to Papertrail. After you finish the installation and a reboot of the service, go to the Papertrail Event Viewer and you’ll see Windows events listed as they are logged on your VM.
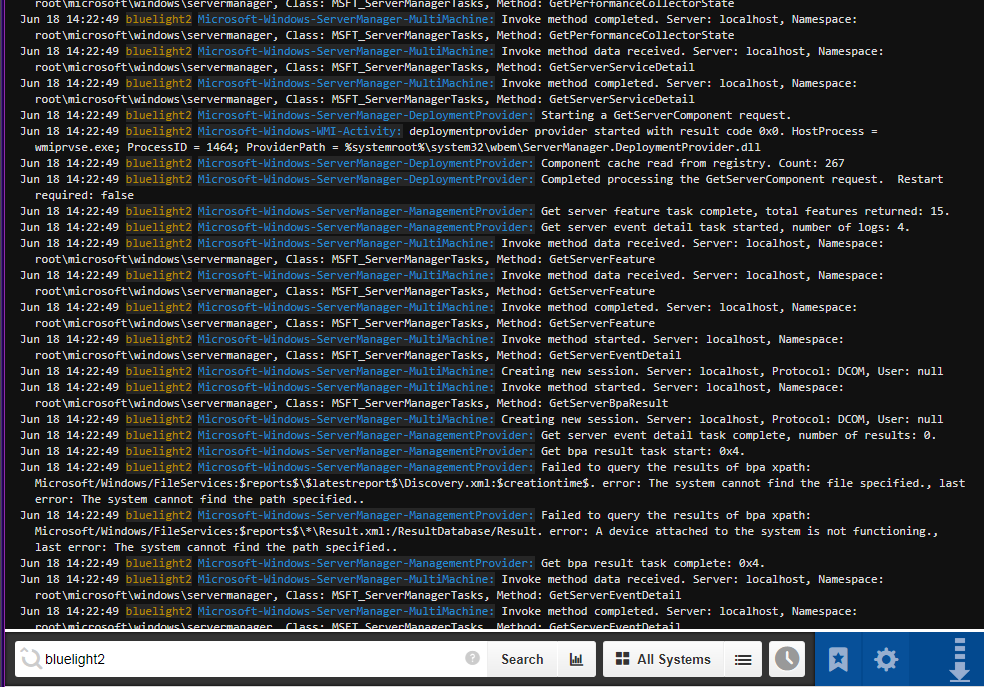
(Windows Azure events in the Papertrail Event Viewer)
You can also stream application events from your own logs by pointing NXLog to “watch files.” In the NXLog “nxlog.conf” file, you’ll find this element commented out.
# Monitor application log files
<Input watchfile>
  Module im_file
  File 'C:\path\to\*.log'
  Exec $Message = $raw_event;
  Exec if file_name() =~ /.*\(.*)/ $SourceName = $1;
  SavePos TRUE
  Recursive TRUE
</Input>
Change the File path to include your own custom log file for NXLog to watch and push to Papertrail. Here is an example:
# Monitor a single application log file
<Input watchfile2>
  Module im_file
  File 'C:\Papertrail\test.log'
  Exec $Message = $raw_event;
  Exec if file_name() =~ /.*\(.*)/ $SourceName = $1;
  SavePos TRUE
  Recursive TRUE
</Input>
In the above configuration, any time changes are made to C:Papertrailtest.log and the events are sent to Papertrail. Note that the backslashes are important with these path configurations; if they are missing, the process will fail.
If you have a .NET development environment, you can use log4net installed on Visual Studio. After it’s installed, configure it for Papertrail and it will work simultaneously with your Visual Studio environment to log errors and exceptions.
Sending Azure Diagnostic Logs
For diagnostic logs, you need an agent such as Logstash or Fluentd to pull your logs from an Azure storage location and stream them to Papertrail. Before you start, you need to configure an Azure Event Hub to aggregate your logs. Also, give permission for Azure to provide access to the logs.
After you set up a hub, you need to set up an input plugin to read from Azure. There are several listed on the Fluentd plugin page and Logstash plugin page. For Papertrail, you then configure the remote syslog plugin to send the logs to Papertrail. For Logstash, you can use the syslog output plugin. Configure them to send logs to the log output destination shown in your Log Destinations account page.
Conclusion
Azure can be beneficial for any organization that needs to scale fast and is not looking to build out their own internal infrastructure. Monitoring a vast array of portal applications, however, can introduce some challenges. Papertrail can help by extending what Azure offers and helping you to aggregate event logs into a consolidated view that simplifies troubleshooting. Papertrail is designed to allow you to easily search, archive, filter, live tail, and graph application logs, which can make issue resolution across applications much easier. Sign up for a free trial today.