DigitalOcean droplets provide low-cost scale from a popular server provider. With DigitalOcean Monitoring, you can collect metrics for visibility, monitor Droplet performance, and receive alerts when problems arise in your infrastructure. But when you need to deep dive into your application to debug an issue, resolve an incident, or identify opportunities to improve your platform, you need a deep understanding of the underlying operating system and how it interacts within its environment. This deeper understanding requires visibility into your DigitalOcean infrastructure and into applications and services.
Correlating behaviors in a clear and concise way takes a lot of effort and time for just one machine, but when scaled to hundreds of machines, it can be like finding a needle in a haystack.
In this article, we’ll set up a deployment of nginx on DigitalOcean, inject a failure, and then look at the tedious steps to debug this failure using native DigitalOcean offerings. Then, we’ll look at how aggregating the DigitalOcean logs to SolarWinds® Papertail™ can help you understand your systems more quickly and thoroughly.
Our Setup
To demonstrate the steps required to identify a single instance with a problem among a group of instances, we’ll set up an environment with four front ends all serving the same nginx application, then inject a failure into just one of them.
In our example, we’ve had a service running for some time with regular deployments from multiple developers. In the last couple days, however, we’ve seen one-off reports of a broken image on our site. However, finding it has been impossible since it reproduces so infrequently. The reports have also been inconsistent with a small subset of these users reporting they see a cat on the page.
Let’s dive in and find our problematic service and see what we can do about it.
DigitalOcean Debugging: A Manual Process
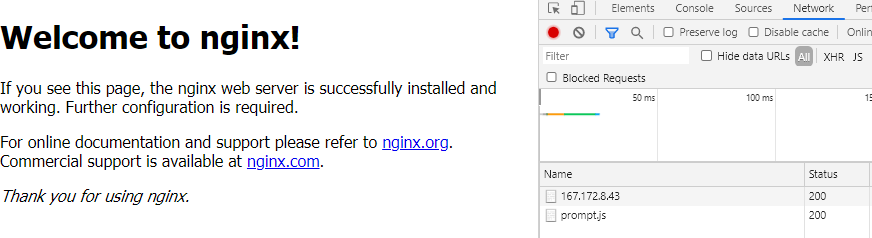
One morning you decide it’s time to really dig in and find the issue. You’ve hit refresh in your browser dozens of times trying to reproduce the problem and finally scored a lucky hit. Let’s take a deeper look into the response headers. Maybe we can see some data on what the cause might be…
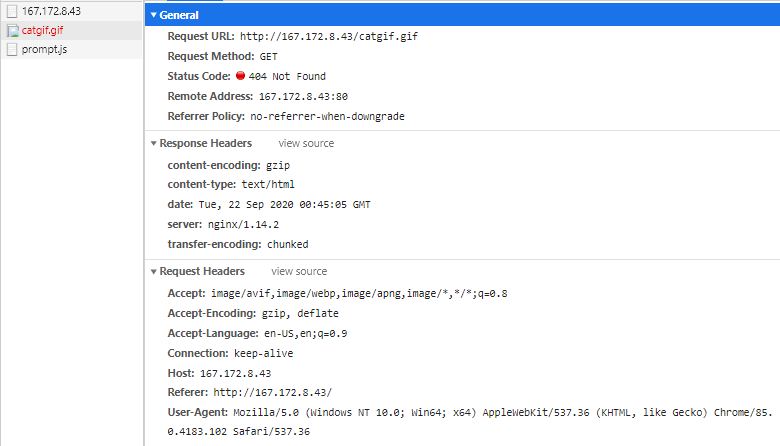
It appears we have a missing catgif.gif on our hands! However, the pages don’t normally load this file, so not all our services appear to be using the same code build.
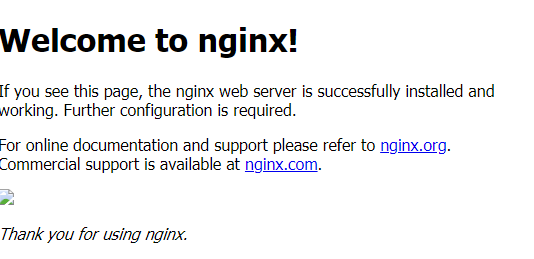
A normal page load for reference:
While the problem definition was simple enough, identifying the root cause is very tricky. How can we find this file dependency across all our infrastructure? DigitalOcean doesn’t provide us with an easy file system grep, or any log aggregation to help determine the issue. Luckily, we don’t have too many services in our environment, so let’s just check one at a time.
First, we get a list of available hosts from DigitalOcean, so we know where to look.
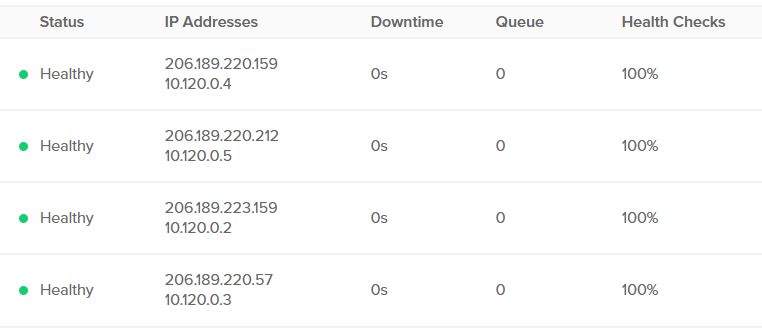
Now that we have our Ips, we can log into each one individually and look for our file, which should be simple enough.
$ ssh 206.189.220.57 -l root "cat /var/www/html/index* | grep catgif.gif"
$ ssh 206.189.223.159 -l root "cat /var/www/html/index* | grep catgif.gif"
$ ssh 206.189.220.212 -l root "cat /var/www/html/index* | grep catgif.gif"
$ ssh 206.189.220.159 -l root "cat /var/www/html/index* | grep catgif.gif"
<img src="./catgif.gif">
We found our bad host! We can simply take it out of traffic and redeploy our code.
We could have shortened this down to a one-liner and found the issue by taking our inventory list and doing some simple bash scripting:
$ cat hosts
Name    Status  IP Addresses    Downtime        Queue   Health Checks
1 GB / 25 GB / SFO2      Healthy
206.189.220.159 Copy
10.120.0.4 Copy 0s      0       100%    More
1 GB / 25 GB / SFO2      Healthy
206.189.220.212 Copy
10.120.0.5 Copy 0s      0       100%    More
1 GB / 25 GB / SFO2      Healthy
206.189.223.159 Copy
10.120.0.2 Copy 0s      0       100%    More
1 GB / 25 GB / SFO2      Healthy
206.189.220.57 Copy
10.120.0.3 Copy 0s      0       100%    More
$ for i in $(cat hosts | grep Copy$ | awk '{print $1}'); do echo $i; ssh root@$i "cat /var/www/html/index* | grep catgif.gif"; done
206.189.220.159
<img src="./catgif.gif">
206.189.220.212
206.189.223.159
206.189.220.57
We could even have used a management tool like Ansible to search across our entire fleet to find the one-off host:
$ ansible -i hosts all -m shell -a "cat /var/www/html/index* | grep catgif.gif" -u root
206.189.220.212 | FAILED | rc=1 >>
non-zero return code
206.189.220.57 | FAILED | rc=1 >>
non-zero return code
206.189.220.159 | CHANGED | rc=0 >>
<img src="./catgif.gif">
206.189.223.159 | FAILED | rc=1 >>
non-zero return code
That was a little easier, but all of these solutions involved manually identifying the problem then searching for the one-off server. When you increase the complexity of the application with a Node or Django application, with many templates and dependencies as you would normally have in production, finding the bad service could be next to impossible.
A Better Way: Automating Log Aggregation to Papertrail
Identifying inconsistencies is a key point in identifying root causes and resolving issues. To empower teams to do this quickly, it’s important to use aggregated data to clearly explain discrepancies and quickly root out the differences in complex architecture.
The way Papertrail implements logging is straightforward and simple: send strings to a domain and a port. The documentation shows a clear example of how to move logs from one place to another:
$ journalctl -f | ncat --ssl logsN.papertrailapp.com XXXXXWith this little command, we can stream data into our given endpoint and aggregate the logs into one simple-to-view event stream, complete with an easy-to-use search function. We can expand on their documentation to create several quick services to manage in our SystemD manager to ensure these commands are always running and gathering our data.
$ cat papertrail.service
[Unit]
Description=Papertrail
After=systemd-journald.service
Requires=systemd-journald.service
[Service]
ExecStart=/bin/sh -c "journalctl -f | ncat --ssl logs5.papertrailapp.com 13702"
TimeoutStartSec=0
Restart=on-failure
RestartSec=5s
[Install]
WantedBy=multi-user.target
$ cat nginxpapertrail.service
[Unit]
Description=Nginx Monitor
[Service]
ExecStart=/bin/sh -c "tail -f /var/log/nginx/* | ncat --ssl logs5.papertrailapp.com 13702"
TimeoutStartSec=0
Restart=on-failure
RestartSec=5s
[Install]
WantedBy=multi-user.target
In Debian 10, we can save these files in /lib/systemd/system/ and do the following, leaving us with a long stream of all our aggregated logging to pinpoint any odd behaviors in our system.
systemctl daemon-reload && \
systemctl enable nginxpapertrail && \
systemctl enable papertrail
Now let’s try finding our needle in the haystack again, this time with the help of Papertrail!
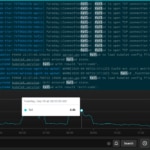
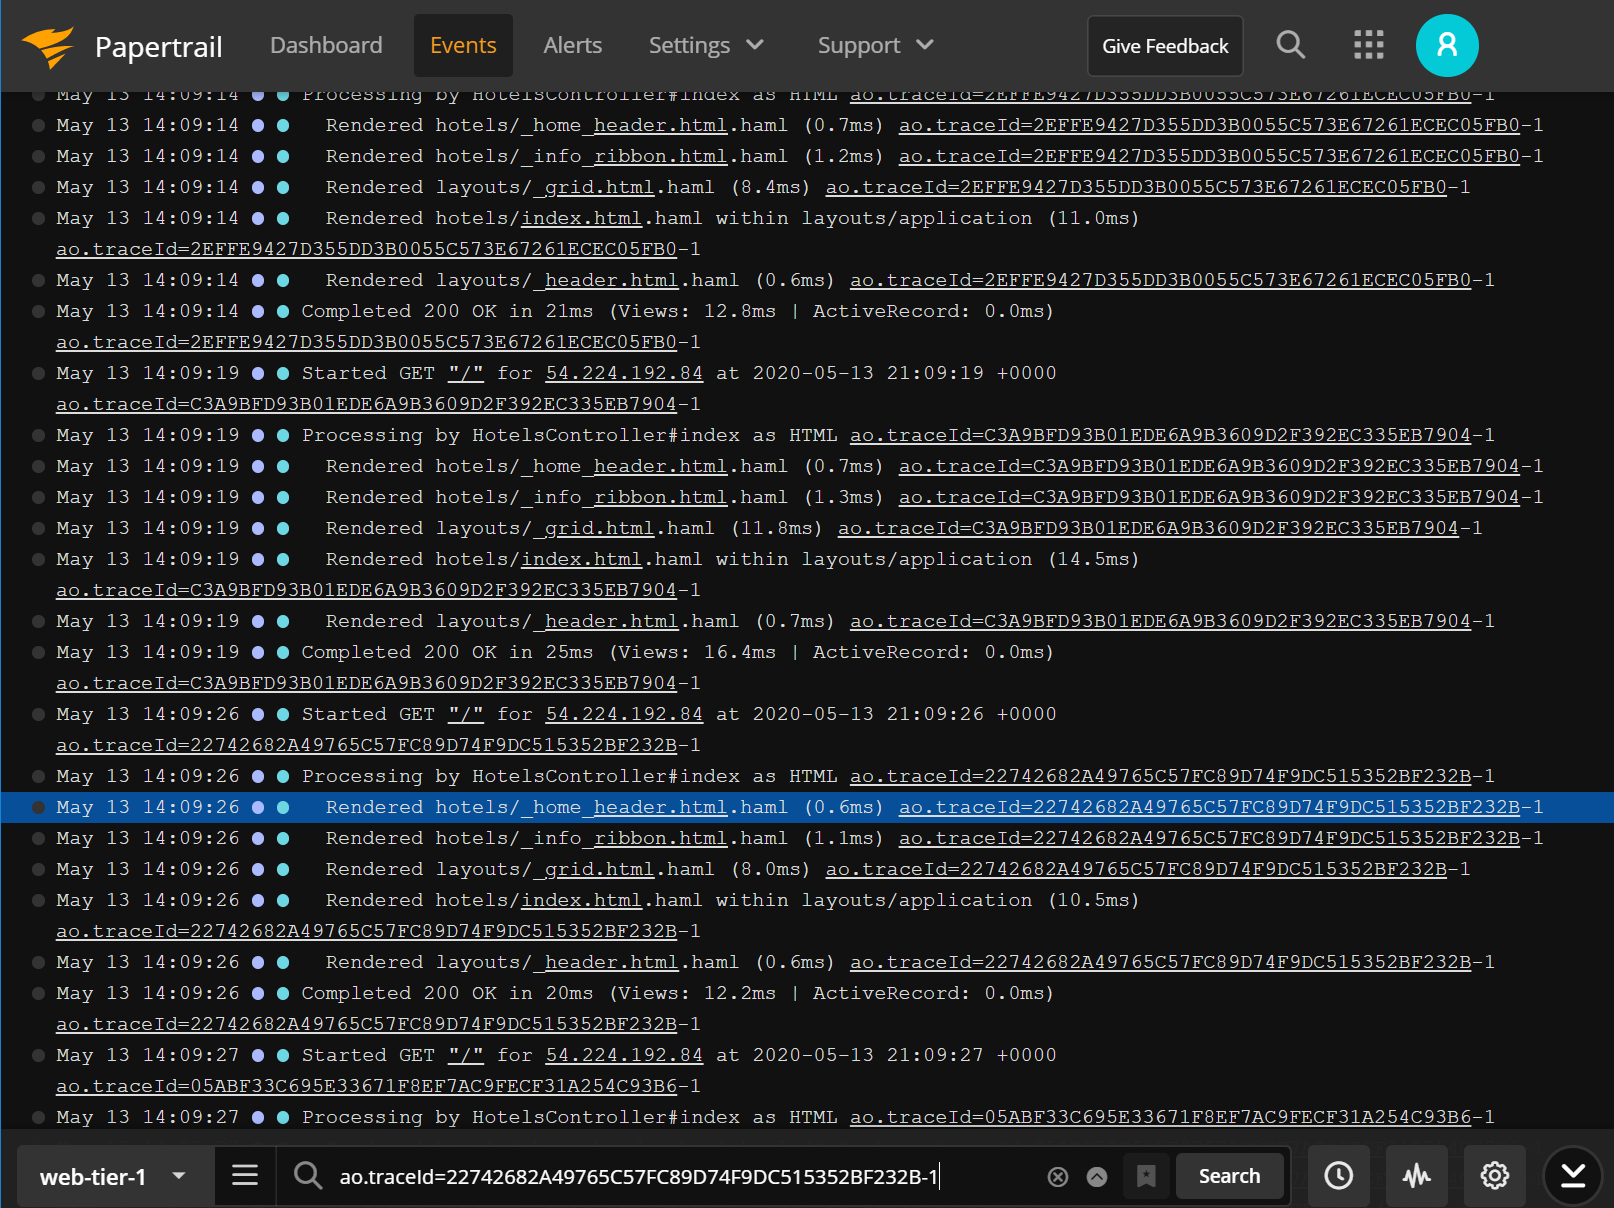
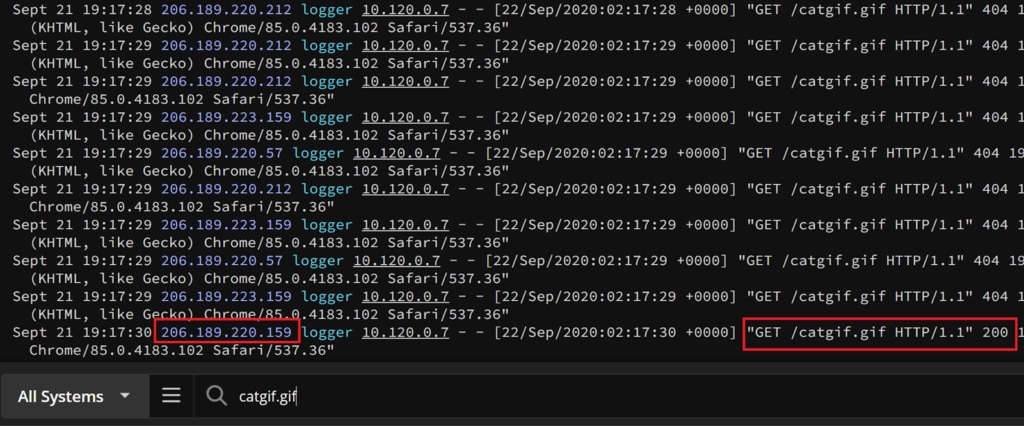
Simply browsing through events in the Papertrail event viewer and performing a search for our missing catgif.gif finds the one server that loads the asset successfully, which in our case is the odd-server-out. Because the 404 is generated when the index page requests the catgif.gif and gets a response without the image, we’re looking for the very infrequent case where both the initial request and the follow-up catgif.gif request land on the same server. This also explains our rare user’s cat-related sightings.
All this with no bash or manual labor required.
Summary
Platform as a Service providers like DigitalOcean help teams deploy quickly and consistently but may not always provide the tools necessary to keep your application running consistently. By aggregating system and application logs with Papertrail, you can save time and reduce complexity, while giving your administrators a one-stop shop for grepping logs and an easy method of gathering data without intricate or resource-intensive applications. The simple ingestion endpoint in Papertrail makes trying it out for your service simple to understand and even easier to implement. If you’re not currently using SolarWinds Papertrail and want to see it for yourself, sign up for a trial.