Logging is a fundamental part of software development. While an app is being developed, we rely on logging to confirm our inputs and outputs match our expectations. In production, logging can be an invaluable resource for tracking down bugs or measuring how users interact with the app.
We can also consider logs as a sort of time-series value, where a timestamp is associated with a user’s specific action. These logs can be structured, gathered, and analyzed to provide teams with more information.
Logs can be generated from many different places in your architecture:
- HTTP requests and responses can be recorded to measure success and error rates.
- Database transactions can be logged to capture the state of data as it changes.
- General debug statements in your application can be helpful when matching users with their behaviors.
While we should be trying to log as much information as possible, the tactic comes with a downside: collecting logs from many different places can make it difficult to find what you’re looking for. For example, if your database is hosted on a platform different from the one used by your application—as is the case with a microservice—tying the two disparate sources together can be challenging.
One solution is to use a cloud-hosted logging platform, like SolarWinds® Papertrail™, to store this information. Centralizing your logs in one location has several advantages. Non-engineering teams (such as the customer support team) can easily access the logs and make decisions relevant to their work. Logging can also yield metrics that reveal information about app performance. For example, let’s say you always expect a certain amount of data to be logged every minute. If the figure suddenly plummets, this could indicate a larger technical issue. Papertrail also provides several features such as the ability to search, analyze, and alert on your log data.
In this post, we’re going to look at places where applying logging makes the most sense. Since WordPress is an incredibly popular blogging and CMS platform—used by about 40% of the web—we’ll talk about logging in the context of WordPress. Of course, most of these guidelines would apply to just about any web application.
Where to Collect Logs From
When you install WordPress on a server, you’re relying on several distinct layers that make up your overall stack. The WordPress web app requires several other resources and dependencies. The most well-known example of this is the requirement to use a mySQL database. The entire web app also needs to be hosted on a web server (WordPress supports Apache and nginx). At the bottom of all these layers is the server itself, and your operating system represents another place where events and messages can be generated. Finally, there’s the WordPress installation itself: various plugins and WordPress PHP debugging tools generate their own activity, which might be important to capture.
All these different pieces represent ideal locations for introducing a pipeline that sends logs to Papertrail. Each component presents an opportunity for routing of log data to Papertrail:
- Logs can be easily aggregated from mySQL.
- Most web servers already follow structured logging practices; for example, here’s how to route nginx logs to Papertrail.
- Papertrail also integrates with multiple services and can be integrated with several operating systems, including Unix.
- Finally, with the WP Activity Log plugin, your WordPress platform and plugin logs can be automatically mirrored to Papertrail.
Identifying where we can insert logging is just the beginning. You’ll also need to make sure these logs are structured in a consistent format across locations. Typically, this means your logs will be written as JSON and will include the same keys, such as:
- The name of the platform emitting the log,
- The severity of the log message, and
- The log string itself.
The documentation for Papertrail provides more information on how to generate structured logs for your database, OS, and web server.
Tracking Down Errors
If an error occurs in a production environment, the most common place a developer will seek information is in the application logs. With a WordPress platform, this tactic is no different. Whether a user experiences a crash, a plugin fails to load, or an unexpected value appears in the database, logs can help provide more context and information around what went wrong.
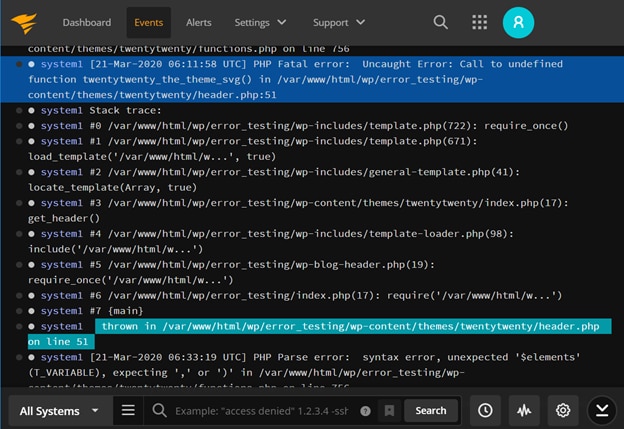
When your logs are kept in a consistently structured format, you can trace the entire lifecycle of a user request. For example, when a user first makes a request on your WordPress site (such as requesting a page), a unique GUID is generated. You could pass this GUID along from one action to another, carrying it through the database layer, plugins, and the eventual response. If at any point in the cycle an error occurs, you can log the GUID alongside any pertinent content information, so you can effectively retrace and replay what happened.
In fact, the WP Activity Log already generates an ID for every action a user performs; this is known as an event ID. You could keep track of this ID and simply send it with the rest of a payload in situations where you need to log information outside of the WP Activity plugin.
Observing User Behavior
Quantitative metrics measure information like disk space, requests per second, and response times. These necessary metrics help you understand how your application performs in a real-world environment. Logs can also be a valuable part of your monitoring and metrics strategies.
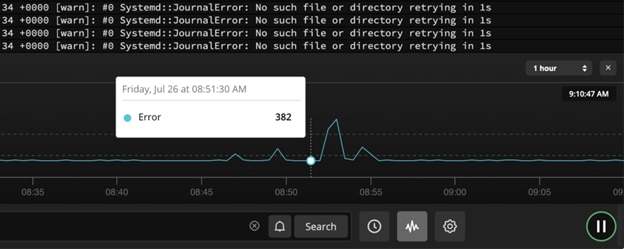
Consider this all-too-common scenario: a developer receives an alert that their web server is emitting an unusually high number of errors. The developer’s first step toward remediation would be to check the logs and see what might be causing the issue. This, however, takes time—even with searching and filtering tools. By the time the alert was received, the server might have been erroring for a while. The developer would need to know exactly what they’re searching for in the logs to begin to understand the issue.
Metrics lag behind other real-time indicators like logs. One way to best leverage logging is to identify which logs tend to appear together. For example, if you know every time a user clicks the Save button, the action updates a database row, then you’d expect there to be at least two log entries recorded within a short timeframe: the user clicking the button and the database performing a transaction. Knowing this, you can measure the time it takes for one entry to appear in Papertrail, followed by the second entry. If the time between these two increases, you can be reasonably sure there’s an issue with your database. In this way, logs raise red flags before the metrics collector identifies the database write times are increasing.
To achieve this, Papertrail has a feature called log velocity analytics, which can help identify silent issues before they become problems. Log velocity analytics can illustrate trends and other patterns in the event volume.
In essence, your logs become an irrefutable source of truth and an event log that maps a user’s activity with application behavior. Filtering and searching are invaluable tools when troubleshooting, but using your logs to proactively catch errors is another great strategy you can use.
Conclusion
Since logs are an essential part of software development, it’s worth the time investment to build a comprehensive strategy around your application’s logging needs. With its ability to integrate with all parts of your stack—the OS, the hosting provider, the database, and the application—Papertrail makes it easy to consolidate and format your logs, store them in one place, and find exactly what you’re looking for when you need it.
For more information on how to get the most out of your WordPress logs, check out our documentation.