Dokku can be a cost-effective, convenient way to deploy apps to DigitalOcean. SolarWinds® Papertrail™ can make monitoring the logs of those apps simple and frustration-free. Combine these two technologies and you have an effective deployment process and log management system. Let’s look at Dokku first.
What Is Dokku?
Dokku is an open-source platform-as-a-service (PaaS). If you’re familiar with Heroku, you can consider Dokku a private Heroku that you manage. In fact, in the Dokku GitHub repo, it’s called a “Docker powered mini-Heroku.”
Dokku installs Docker and then uses it to manage deployments of applications. You can control Dokku through simple CLI commands or through a web interface using third-party libraries. A DigitalOcean account makes using Dokku even easier. Simply visit the Dokku page in the DigitalOcean marketplace and click the “Create Dokku Droplet” button. Then configure the Droplet you want your Dokku instance to run on and click the “Create Droplet” button. Once your instance is provisioned, you’ll have to configure it.
Visit the IP address or domain of your droplet to set up your Dokku instance. If you don’t want to use the default settings, click the “Finish Setup” button. Setting up Dokku only takes a few seconds, and you’re ready to create your first Dokku application.
Creating a Dokku Application
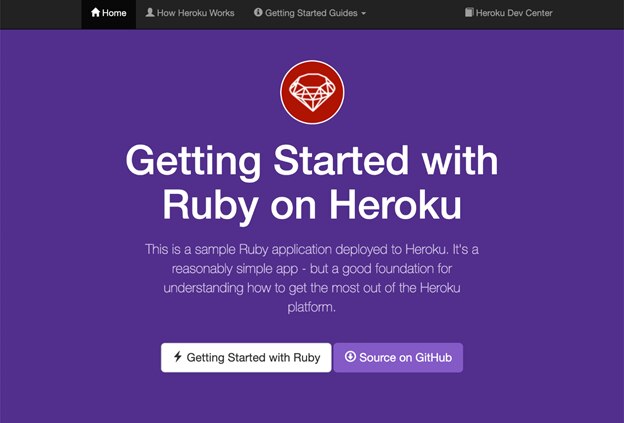
Now you can follow along and use the Heroku Ruby example app, or one of the other Heroku example apps available in just about any programming language you can think of. Applications are deployed to Dokku with a git push, so you need to clone one of these apps to your local machine first. This is the command to clone the Ruby app.
git clone https://github.com/heroku/ruby-getting-started
We’ll get back to this local repo after setting up Dokku. SSH into your Dokku host and run the following command there to create a home for your new app.
dokku apps:create ruby-getting-started
This app requires a PostgreSQL database. To add one with Dokku, you’ll need to install a Dokku plugin for the datastore. This is the command you need to run in your Dokku host to install the datastore for PostgreSQL:
dokku plugin:install https://github.com/dokku/dokku-postgres.git
Next, you need to create a PostgreSQL service using the following command:
dokku postgres:create railsdatabase
This will create another container running PostgreSQL for your app to use. Now you need to link the database service to your app with this command:
dokku postgres:link railsdatabase ruby-getting-started
This will set the DATABASE_URL environment variable of the app to the connection string of the new PostgreSQL database. That’s all the provisioning you need to do. Now it’s time to deploy the app.
Browse to the folder of the repo you cloned via the command line. Use the following command to add your Dokku server as a remote git repo:
git remote add dokku dokku@<DOKKU_IP_ADDRESS_OR_DOMAIN>:ruby-getting-started
Replace DOKKUIPADDRESSORDOMAIN with the actual IP or domain. Once it’s set as a remote, deploying changes to the live server only involves a git push. Deploy the app to your server with the following command:
git push dokku main:master
It’ll take about a minute to build and deploy the app to the server. You should see an output like the following:
Total 0 (delta 0), reused 0 (delta 0), pack-reused 0
-----> Cleaning up...
-----> Building ruby-getting-started from herokuish...
-----> Setting config vars
CURL_CONNECT_TIMEOUT: 90
-----> Setting config vars
CURL_TIMEOUT: 600
-----> Adding BUILD_ENV to build environment...

...

=====> Application deployed:
http://ruby-getting-started.dokku-ubuntu-s-1vcpu-1gb-nyc1-01

To 167.99.229.74:ruby-getting-started
* [new branch] main -> master
If you assigned a domain to your Dokku server, then the URL of the application that prints in the console will be correct. However, if you deployed to an IP address like we did, then you can find the app running at that IP address.
Setting Up Dokku Logs With Papertrail
Setting up Dokku was quick and easy. We launched both an application server and a database server in a few minutes. However, without a few more additions to our application, dealing with the logs isn’t so easy. Right now, we can tail the logs using another Dokku command, but that doesn’t give us a convenient way to search them, nor does it allow sending alerts if there’s an exception. Fortunately, sending the logs to Papertrail where we can search, tail, set up alerts, and more is even easier to set up.
Installing Plugins
To add Papertrail, you need to add another plugin to your Dokku installation. So, connect to the server again with SSH and run the following command to add the dokku-logspout plugin.
dokku plugin:install https://github.com/michaelshobbs/dokku-logspout.git
This will install the plugin, check for updates, and sometimes install an update right afterwards. It should happen pretty quickly. You can ensure everything is working by running the following commands and then reloading your app in the browser:
dokku logspout:start
dokku logspout:stream
You should see the logs from the page load in the console.
Logging into Papertrail
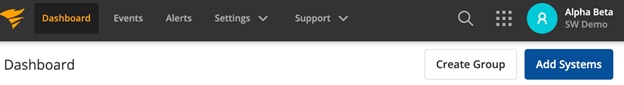
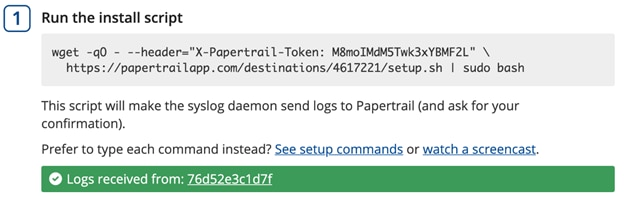
Now you need to log in to Papertrail and click on the Add Systems button.
On the next page, you’ll see the URL your logs will go to.
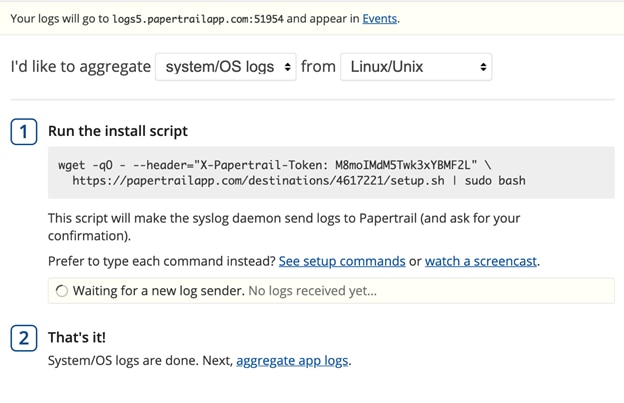
Here, the URL is logs5.papertrailapp.com:51954. We need this to configure logspout. Now go back to your SSH connection, so you can edit the /home/dokku/.logspout/OPTS file to look like:
export DOKKU_LOGSPOUT_PORT=18000
export DOKKU_LOGSPOUT_IMAGE_VERSION=v3.2.6
export DOKKU_LOGSPOUT_SYSLOG_SERVER=syslog+tls://logs5.papertrailapp.com:51954
Replace the Papertrail URL with your own. Next you’ll need to restart the logspout container using these commands:
dokku logspout:stop
dokku logspout:start
Now when you go back to the Papertrail dashboard, you should see a “Logs received” message.
If you don’t see this, run this command to rebuild your apps, and it will show up:
dokku ps:rebuildall
Monitoring Dokku Logs With Papertrail
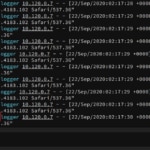
Now you can navigate to the Events tab in Papertrail. If you’re aggregating many logs in Papertrail, it could scroll pretty fast as new events are written.
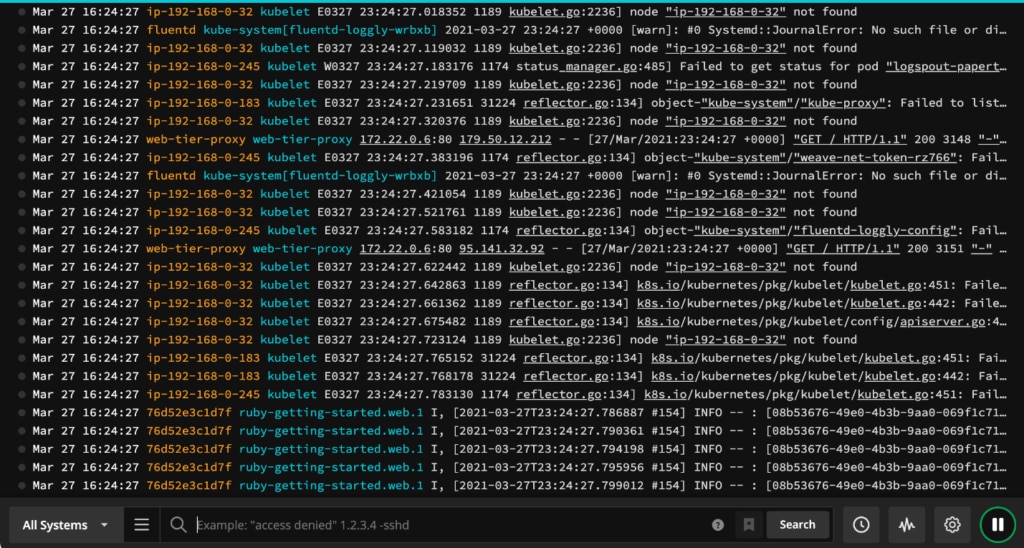
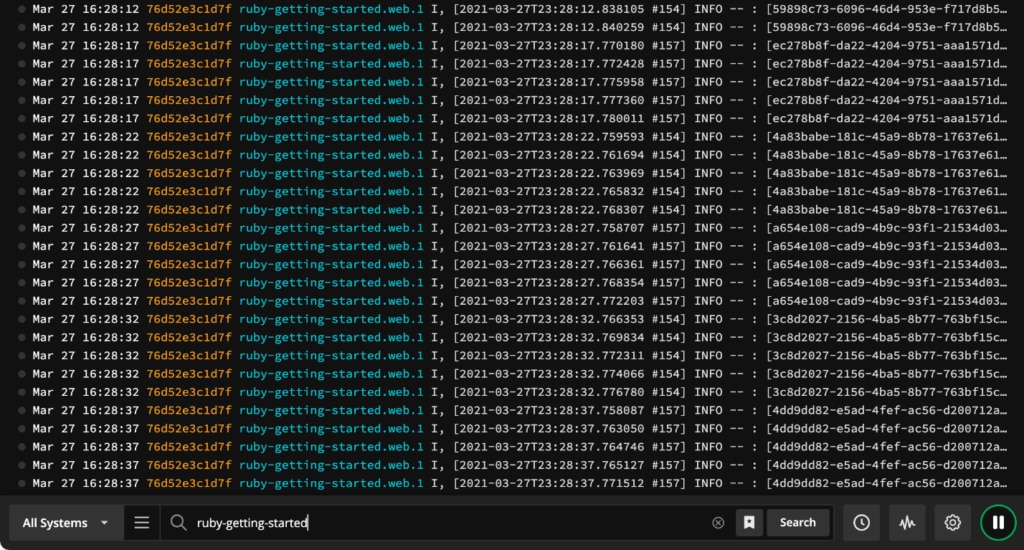
You can see the ruby-getting-started at the end of the logs above. To filter all the logs by that app, type “ruby-getting-started” in the search field.
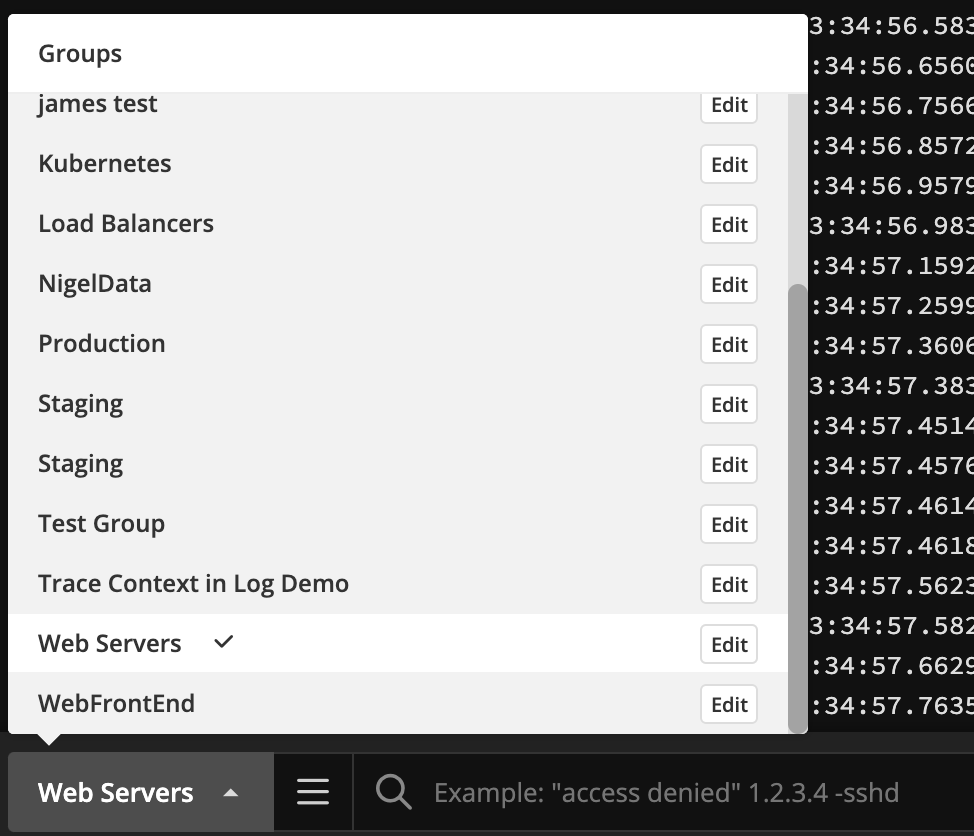
You can also create groups and add the app to a group.
You can also bring up a velocity graph to see how the logs stack up over time.
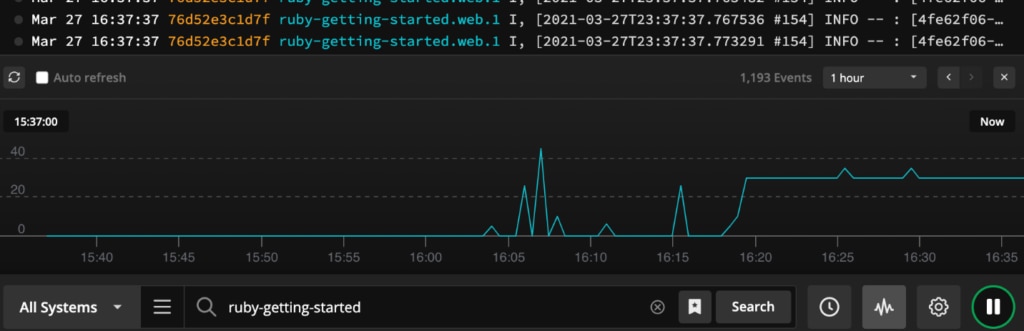
Other features include the pause button to stop the logs from displaying new events as they’re being written and the clock button, which allows you to find logs at a specific date or time.
Search and Alerts
Another important feature is the ability to save searches and create alerts based on those searches. By clicking on the bookmark button to the right of the search field, you can save a search.
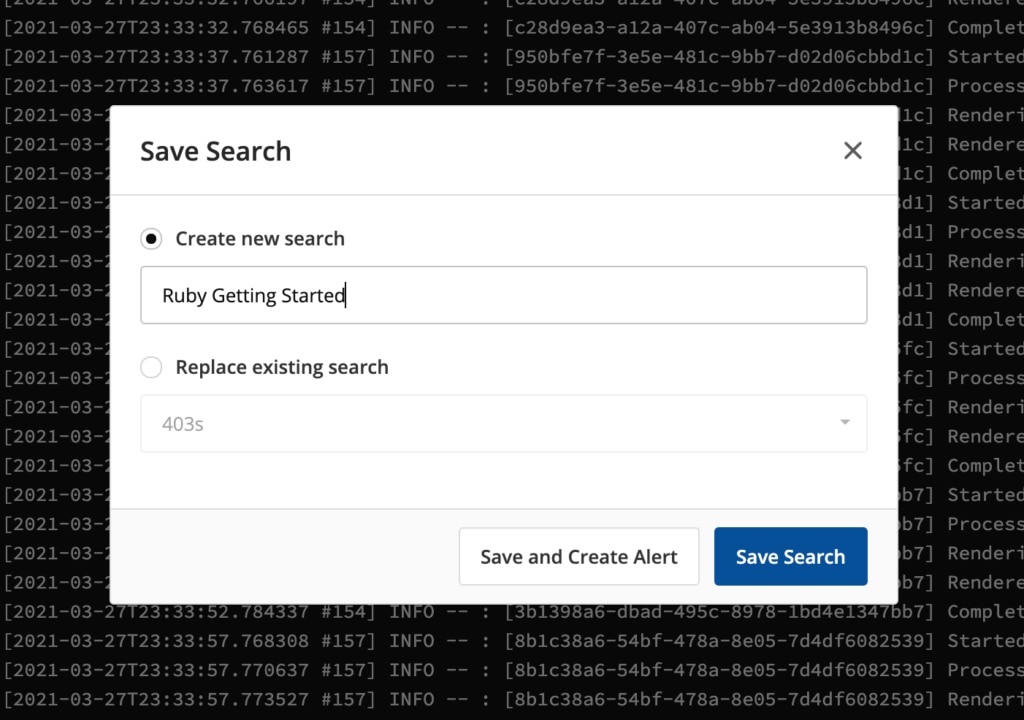
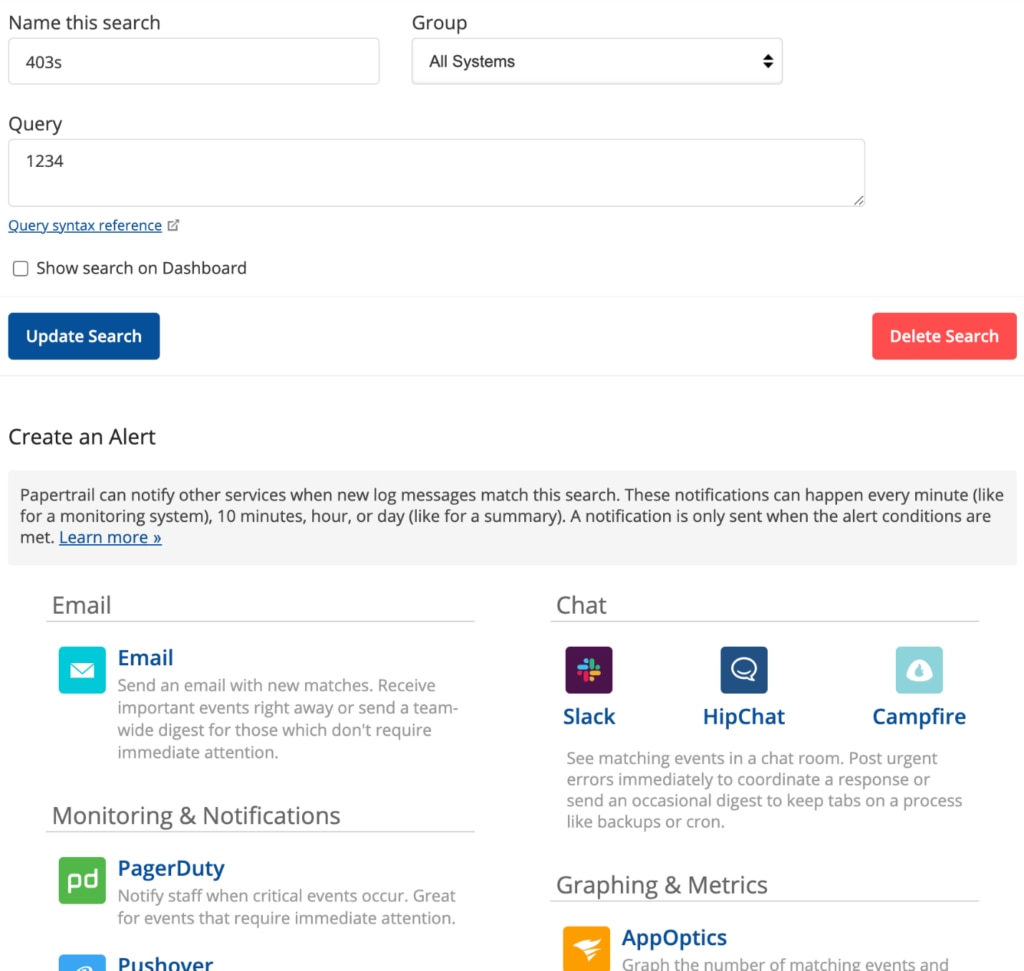
Since we don’t need an alert every time someone hits the Ruby app, we’ll save this search. But creating alerts for errors is more useful. Papertrail gives you the ability to send alerts via email, Slack, HipChat, Campfire, and other third-party applications.
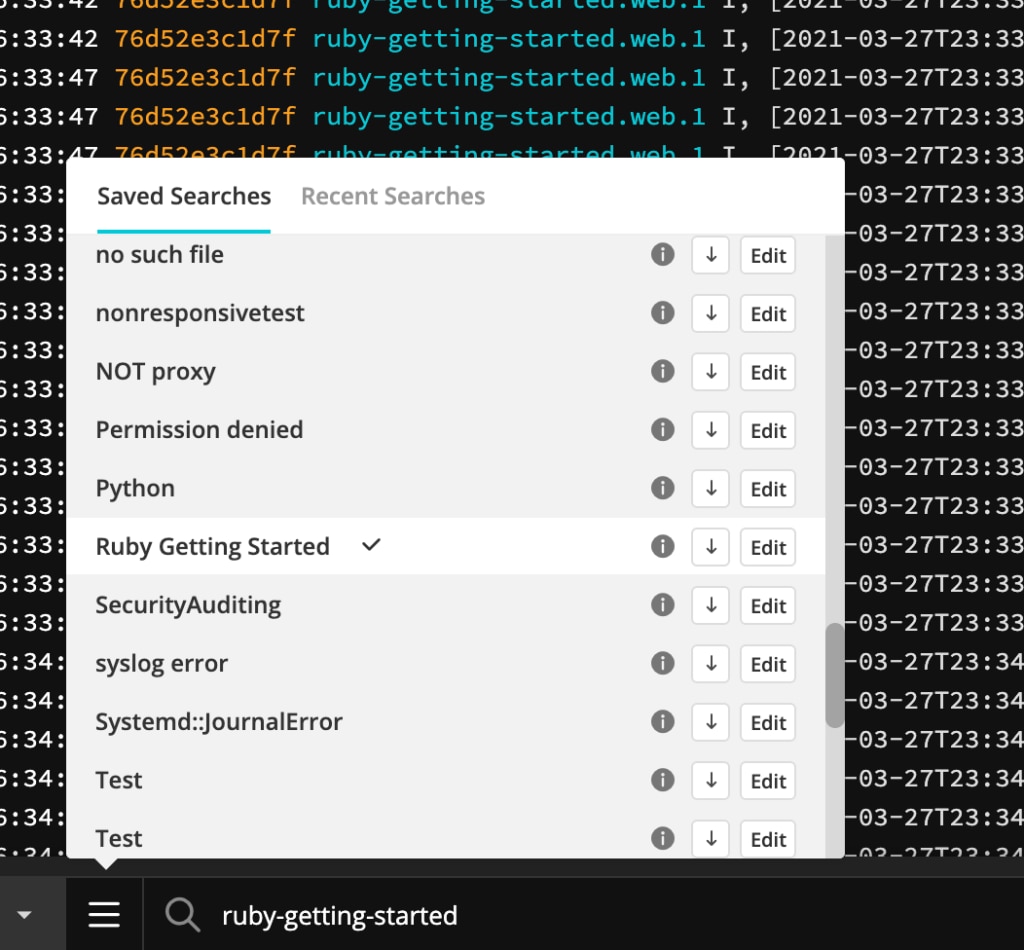
Once you’ve saved your search, you can find it in the hamburger menu to the left of the search field.
Conclusion
Dokku can make it easy to set up quick apps or prototypes, but for all the ease it adds to your deployment process, monitoring the logs of all your Dokku servers can add complexity back into your processes. Shipping your logs to Papertrail makes monitoring your Dokku app logs not only simple again, but adds features like filtering, saved searches, and alerts from one central dashboard that aggregates all your logs. Sign up for a free trial of SolarWinds Papertrail if you want to give this a try yourself.