Kubernetes work queues are a great way to manage the prioritization and execution of long-running or expensive menial tasks. DigitalOcean managed Kubernetes services makes deploying a work queue straightforward. But what happens when your work queues don’t operate the way you expect? SolarWinds® Papertrail™ advanced log management complements the monitoring tools provided by DigitalOcean and simplifies both the debugging and root cause analysis process.
In the first article in this two-part series, we created a Kubernetes cluster with a work queue and deployed a complex job to that queue. We showed the limitations of the built-in log monitoring capabilities and the need for more advanced log management. We set up a log destination in Papertrail and started streaming logs into the Papertrail event viewer.
In this article, the conclusion to this series, we’ll explore different options for monitoring and searching logs from Kubernetes clusters with Papertrail. We’ll walk through some specific debugging approaches with our work queues. We’ll also look at some common problems you might have with the queues, and a few ways to fix them.
Kubernetes Cluster Log Management With Papertrail
Papertrail uses a Docker Image with Fluentd to catch the logs from Docker containers, systems, and Kubernetes Clusters and then forwards them to your Papertrail service. This means there’s minimal configuration required beyond the use of the Docker image itself.
There are multiple approaches available for logging using SolarWinds Papertrail.
- Software developers can implement application-level logging using Papertrail programming language (e.g., PHP, Ruby, Node.js, Java, .NET) and specific libraries or frameworks (e.g., Rails). This isn’t my preference since it requires source-level changes if the IT team later decides to switch to another enterprise logging solution.
- IT Operations would prefer a dedicated logger sidecar-container design pattern (i.e., extend Container behavior to keep common functions, such as logging, performance, and security, separate from primary application function, and inject it independently later) for the Application cluster. However, this has limited log data available about the Containers and the system.
- IT infrastructure teams prefer resilient system-level logging using Kubernetes DaemonSet. This is far more complex and requires privileged mode access but offers comprehensive logs end-to-end. It’s more suitable for Kubernetes Deployments.
- If, however, you need a lightweight method of gathering just the logs propagated by the Kubernetes ecosystem without the permissions or daemons, you could use the new rKubelog connector. This is useful when you don’t have ownership of the infrastructure or can’t deploy Daemonsets to places like EKS or nodeless clusters.
If you need an output from standard docker logs streams, then you can use Papertrail logspout DaemonSet. Just issue the following commands in a Terminal window:
$ kubectl create secret generic papertrail-destination --from-literal=papertrail-destination=syslog+tls://logs9.papertrailapp.com:43210
$ kubectl create -f https://papertrailapp.com/tools/papertrail-logspout-daemonset.yml
This installs a Kubernetes DaemonSet (i.e. logspout) in your DigitalOcean Kubernetes Cluster, which uses a standard syslog collector of SolarWinds Papertrail service. The logspout sends less log data compared to fluentd, which has an important impact on logs storage requirements.
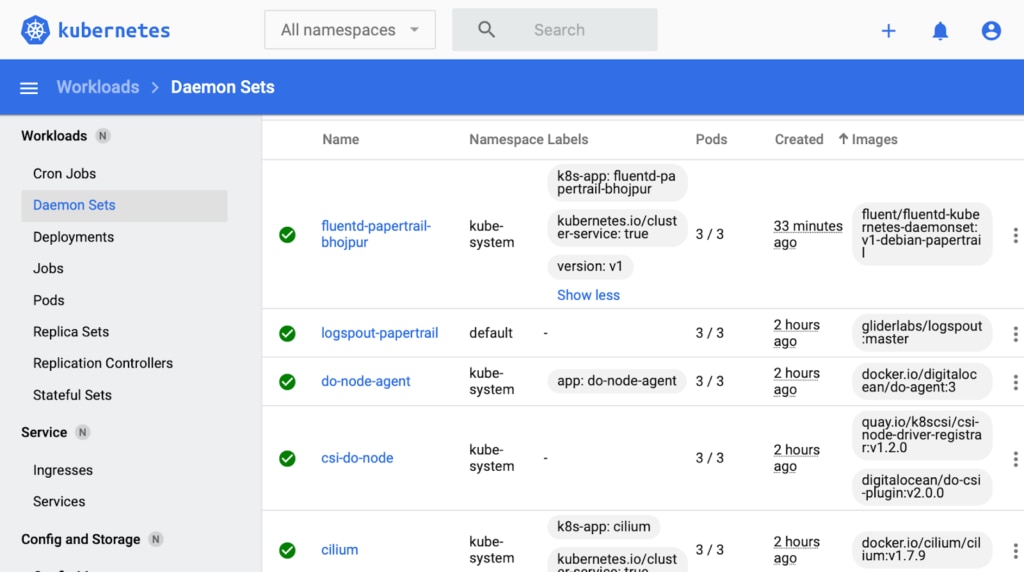
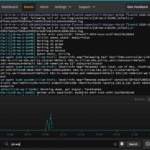
Finally, deploy your Kubernetes Job into the cluster. The logs begin appearing in the Papertrail Event Viewer. If you don’t see the logs, then go to the Kubernetes Dashboard.
If Fluentd Papertrail DaemonSet isn’t installed properly, issue the following command to remove the DaemonSet. Then, re-run the previous commands after fixing them.
$ kubectl delete -f fluentd-daemonset-papertrail.yamlFurthermore, you can configure the Papertrail service to send a summary of errors periodically or create event-based alerts targeting your preferred IT systems (e.g. Email, Slack, PagerDuty, Zapier, and so on).
Troubleshooting Using SolarWinds Papertrail
Now that we’ve set up Papertrail and connected it to our system, let’s look at how to use it to debug a Work Queue.
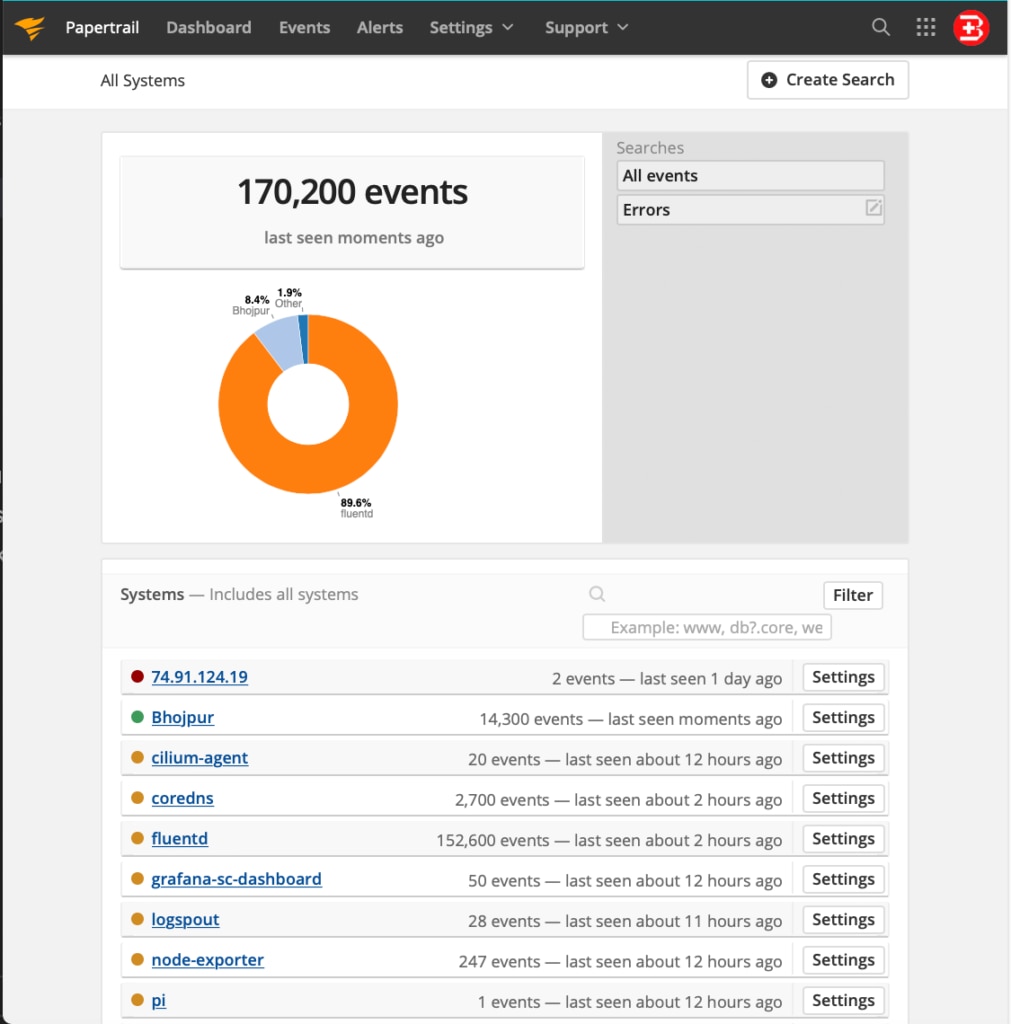
First, check to be sure the Papertrail service is connected properly and receives the latest logs from your source system. Check the last log time, as shown below. Also, you must verify the number of days for log rotation. (The default is two days in a free plan.)
Also, consider tagging your logs properly to identify the source. Typically, Papertrail will auto-detect and intelligently auto-tag log source name (using application name, IP address, and so on) but name conflicts might happen in this scenario since similar log source names might exist in different Kubernetes Clusters in your organization.
Deploying a Work Queue With Issues on Kubernetes Clusters
Now let’s deploy our queue. A popular example from the Kubernetes maintainers themselves is the Redis work queue found at https://kubernetes.io/docs/tasks/job/fine-parallel-processing-work-queue/.
1. Create a local folder and issue the following file download commands.
$ wget https://kubernetes.io/examples/application/job/redis/redis-pod.yaml
$ wget https://kubernetes.io/examples/application/job/redis/redis-service.yaml
$ wget https://kubernetes.io/examples/application/job/redis/Dockerfile
$ wget https://kubernetes.io/examples/application/job/redis/job.yaml
$ wget https://kubernetes.io/examples/application/job/redis/rediswq.py
$ wget https://kubernetes.io/examples/application/job/redis/worker.py
Now, all the relevant editable files are ready to use locally.
2. Create a Kubernetes pod and service based on Redis (as shown below).
$ kubectl apply -f redis-pod.yaml
$ kubectl apply -f redis-service.yaml
3. Fill the Redis instance with Tasks by using redis-cli.
$ kubectl exec -it redis-master -- redis-cli Once you see the redis-cli command prompt, add your data.
redis:6379> rpush job2 "apple"
redis:6379> rpush job2 "banana"
redis:6379> rpush job2 "cherry"
Be sure to enter “exit” at the end.
4. Now, create a Docker image with the Python worker program. Be sure the Docker daemon is running before issuing the following commands.
$ docker build -t job-wq-2 .
$ docker tag job-wq-2 bhojpur/job-wq-2
$ docker push bhojpur/job-wq-2
Once the Docker image is published to your Docker Hub public repository, you can pull it while running the Job on DigitalOcean Kubernetes Cluster.
5. Define a Kubernetes Job by editing the job.yaml file downloaded earlier. Change the image field to bhojpur/job-wq-2
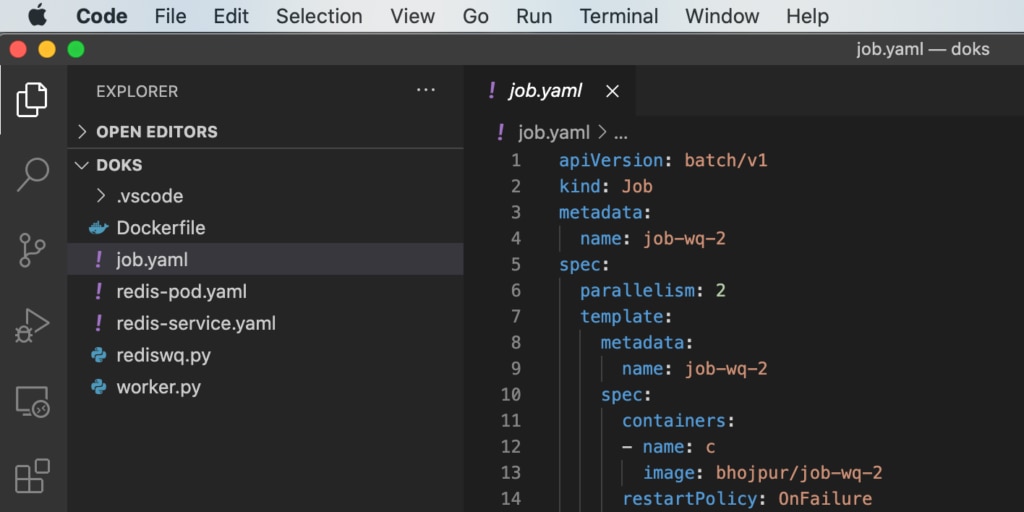
6. Finally, run the Kubernetes Job by issuing the following command:
$ kubectl apply -f ./job.yamlUsing Papertrail for Debugging DigitalOcean Kubernetes
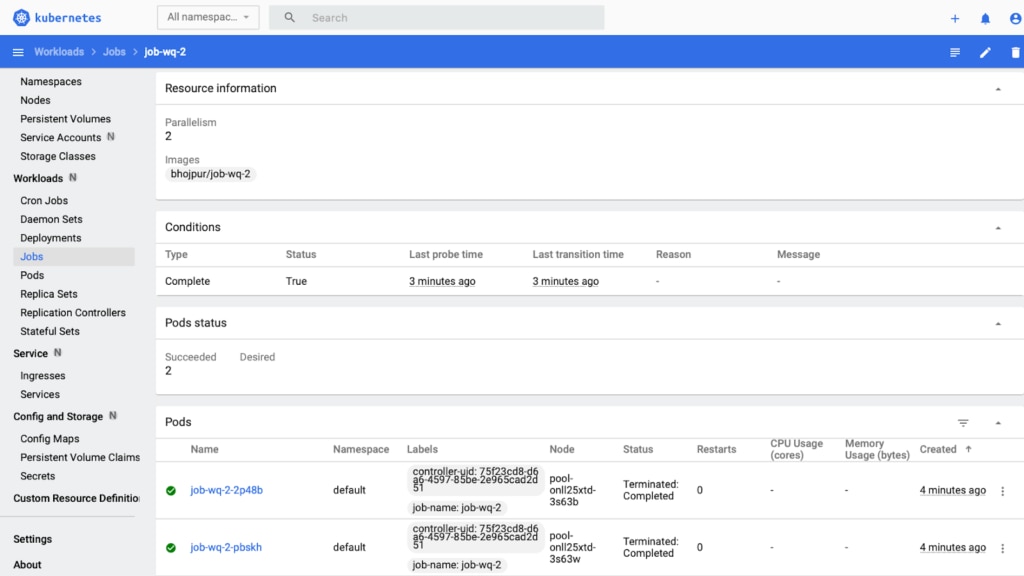
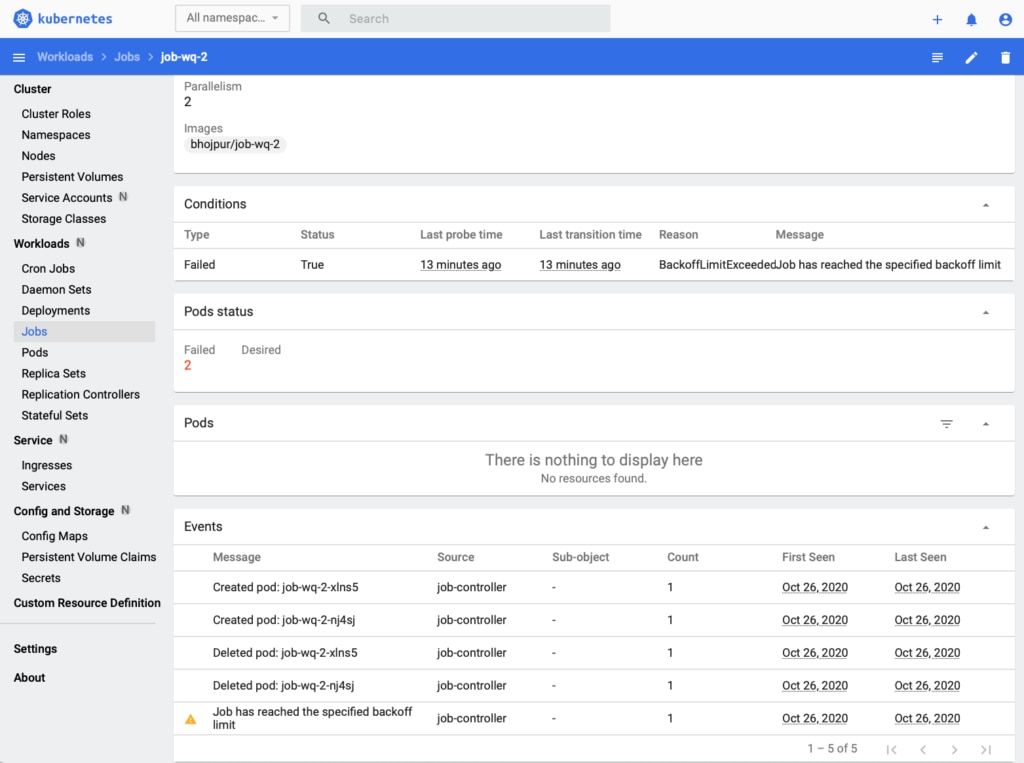
Once the Job deploys successfully, you should see the following Job details in the Kubernetes dashboard:
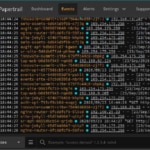
Check the Papertrail Event Viewer as well as the logs printed by the Kubernetes Job. In the event viewer, you can see the execution graph by clicking the gear button at the bottom of the screen. You can also narrow down the query by typing job-wq in the search bar.
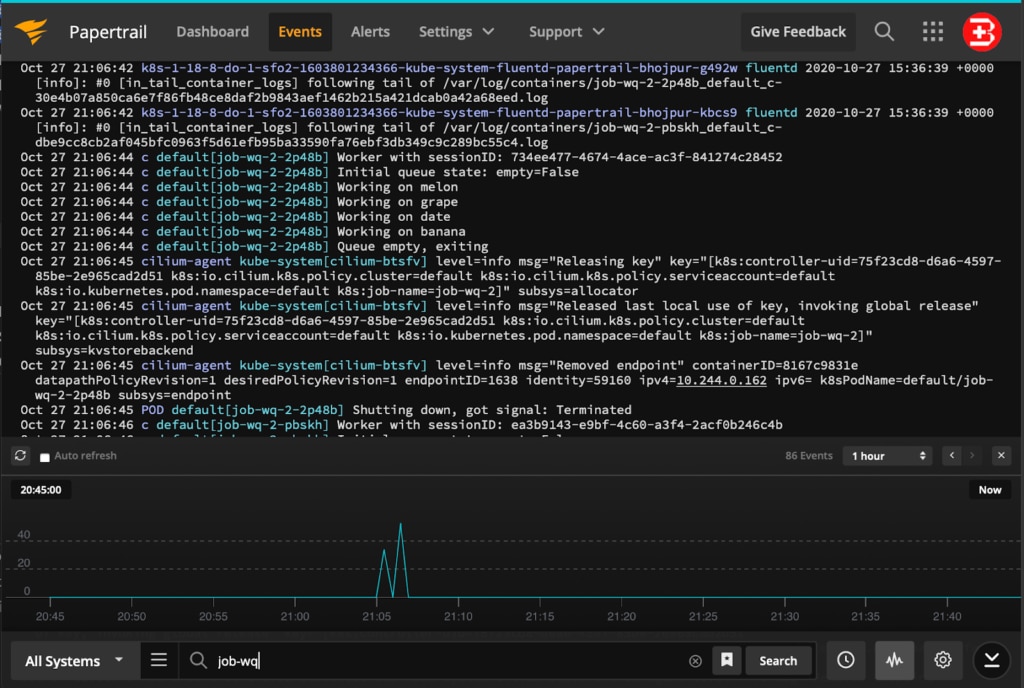
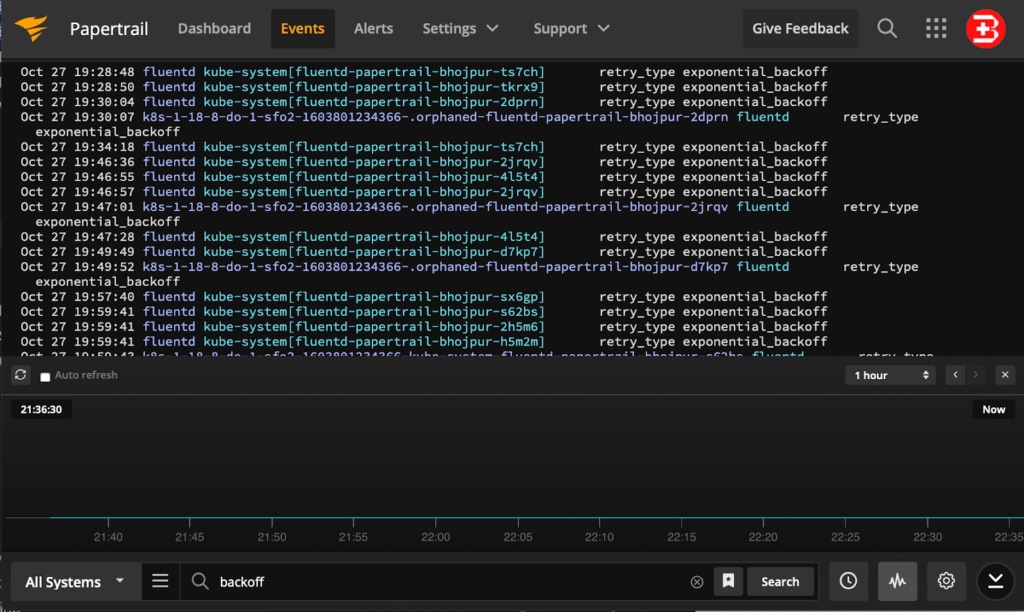
Below is an example of our Python Job that has failed due to the back-off limit; therefore, it must be stopped by the Kubernetes Cluster.
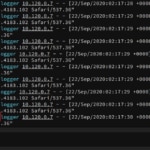
If we investigate this Job using the Papertrail Event Viewer, we see it failed to execute because it was unable to connect to the Redis instance.
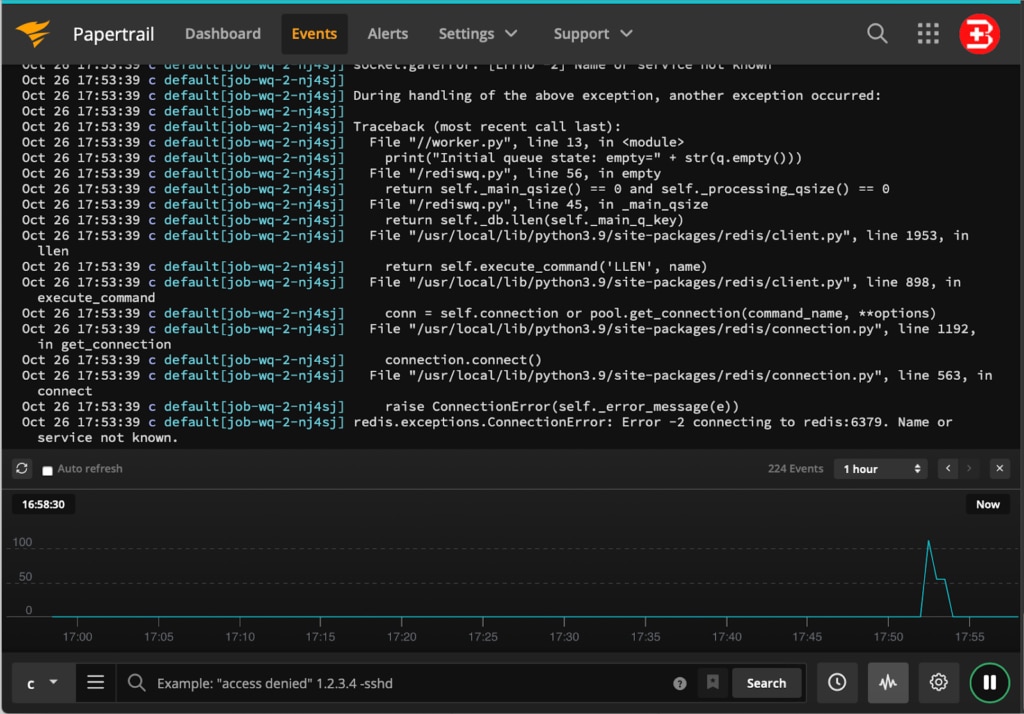
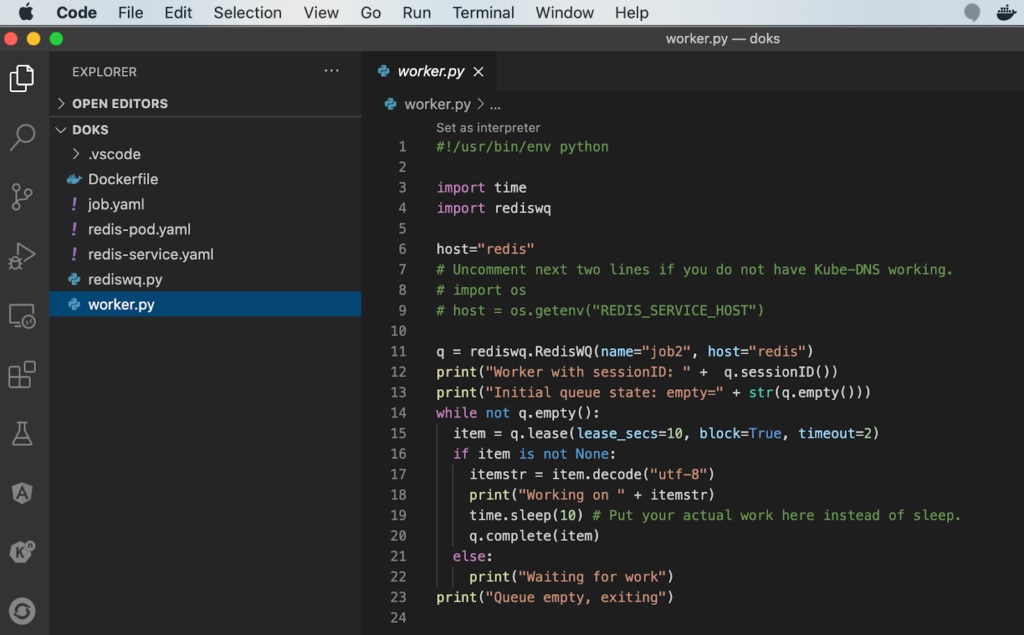
We see an error on line 13 of our source code in the worker.py file. By setting the Context button (as shown at the bottom of the screen), you can type a keyword to search from the logs, define search filters, and save the search for repeated use later. You can create alerts in Papertrail to notify external services when new log messages match the log search. The graph shows occurrences of events based on your search criteria.
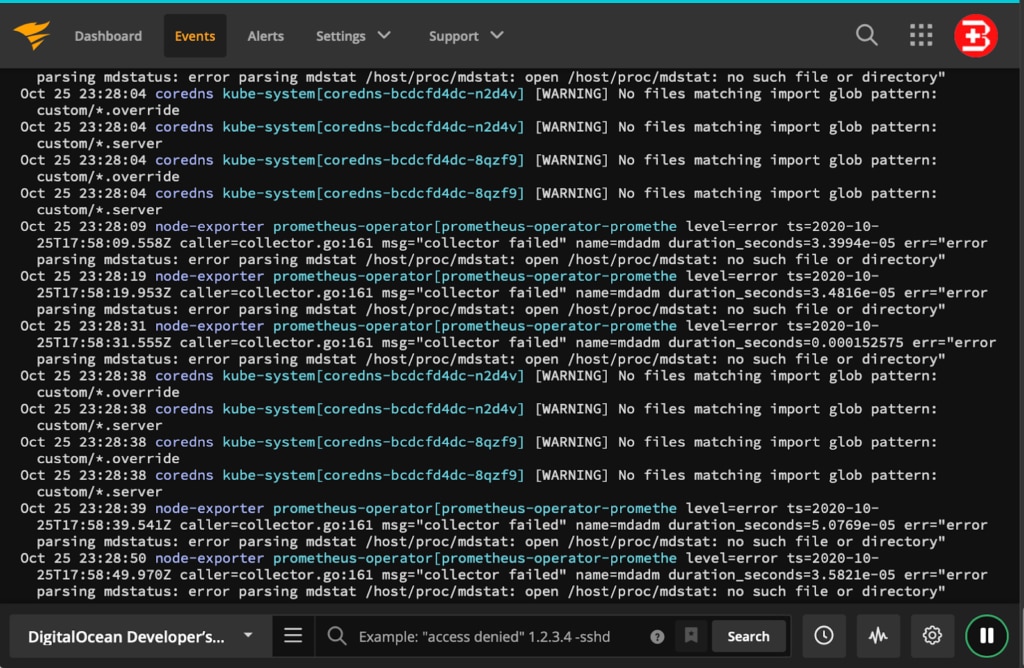
Using SolarWinds Papertrail to Identify Problem Areas
As shown in the previous example, SolarWinds Papertrail points to the line number, so developers can quickly investigate the issue. However, this issue that caused our job backoff failure above is related to domain name resolution to our Redis DB since the Kubernetes CoreDNS is not responding with the right IP address.
If your Job deployed in your Kubernetes Clusterisn’t working properly, try to categorize the problem for quicker resolution. For example:
- Verify from the Kubernetes dashboard that the Kubernetes Cluster is functioning properly. If it is, check all the key components (Nodes, Pods, DaemonSet, StatefulSets, CronJobs, Jobs, and so on) to see if they’re in green status. Sometimes problems occur due to incorrect credentials or insufficient authorization or access to certain folders.
- Verify from the Papertrail Dashboard that the Logger Service is working properly. If it is, check to see the latest logs are streaming from your target systems/pods to Papertrail. Sometimes the logger service fails to install properly due to authorization issues; therefore, it doesn’t report the error even though the Job fails continuously.
- Verify from the Kubernetes Dashboard that the application-related Services installed on Kubernetes Cluster are functioning properly. Check that all required DNS and databases are running properly
- Verify from the Kubernetes Dashboard that the Kubernetes Job runs and completes successfully. If the job is throwing an error, check the logs section in the Jobs dashboard. If the Job failed without logging, then it might be a cluster configuration-related issue. Pre-emptive termination by the Kubernetes Cluster indicates either incorrect policy settings, service reachability issues, or programming errors in the Job itself.
What Should You Watch for in a Work Queue?
Papertrail stores the logging information from distributed resources, application components, platform services, cluster nodes, data center infrastructure, and so on, all in one place. This enables quick and easy searching. However, you need to create the right search filters, events, and alerts to make the tool work for you.
Consider watching for the following keywords:
- backoffLimit reached (re-trials are unsuccessful)
- completions status (crashes are happening frequently)
- parallelism issues (monitoring number of pods running simultaneously)
- activeDeadlineSeconds limit reached (incorrect time estimates for Job or failure)
There are various methods of resolving these issues. You can try to set the following properties in the Kubernetes Job .yaml file and redeploy the Job after optimization.
- Set the backoffLimit property in the Kubernetes Job specification to limit the maximum number of allowable retries before a Job fails, so you can delete it.
- Set the completions property in the Kubernetes Job specification to mention the minimum number of pods that must successfully complete the task.
- Set the parallelism property in the Kubernetes Job specification to mention the number of Jobs to run in parallel. Such scenarios could be useful in crypto-currency processing use cases.
- Set the activeDeadlineSeconds property in the Kubernetes Job specification to mention the time available to pods (inclusive of all the pods related to the Job).
Conclusion
DigitalOcean is a feature-rich cloud platform with flexibility to run Kubernetes Cluster easily and integrate with the right tools for monitoring infrastructure and application issues. SolarWinds Papertrail complements DigitalOcean by providing log capabilities for deeper insights into the DigitalOcean Kubernetes clusters and our work queue Jobs, allowing for faster troubleshooting.