When you’re troubleshooting, issues seem to fall into two categories: issues based on an alert or error message where you have a good idea where to start and ones where you have no idea what’s going on. The first issues are usually straightforward. You use the information provided in the alert or error message to search the logs and pull up the relevant event messages. By searching a little more and exploring the context around the events, you can deduce the cause of the problem and start remediation.
The second type of issues—the ones where the error message is vague, or the alert doesn’t provide additional details—is more difficult.
Take for example, the Ruby internal server message “We’re sorry, but something went wrong.”
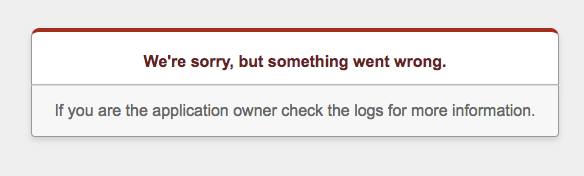
There’s nothing in the message providing any clues as to what the problem is, so where do you start? You can visually scan all the event messages around the same time period as the error or alert, but beyond the fact this is tedious and time-consuming, it’s easy to miss the relevant events among all the lines of normal events scrolling by. CLE
Here at SolarWinds® Papertrail™, there’s a general approach we use to spot these unknown events:
- Explore changes in event message volumes
- Filter out “normal” events to find unusual events and anomalies
It’s not rocket science, but it helps cut down debugging time and accelerate issue resolution.
Changes in the Event Message Volume
Looking at the volumes of event messages around the time of an error or alert can be a great place to start when you don’t know what you’re looking for. For most applications and systems, event message volumes fluctuate in a known range. If there’s a sudden or unexplained change in the event message volume before or around the time of an error message, it’s worth investigating.
For example, if you see an increase in event volumes, it could mean your application is handling more users or your users are using more aspects of your, which could be good thing. On the other hand, if you see a sudden spike in event volumes, it could be a cascading failure like the one that took down Amazon DynamoDB in 2015.
Even a drop in the number of event messages doesn’t necessarily mean the system is running well. Decreases in event throughput could indicate there’s a network connectivity issue or the application has crashed. Still, it’s key to identify and investigate changes in the volume of event messages when you’re troubleshooting an unusual or unknown issue.
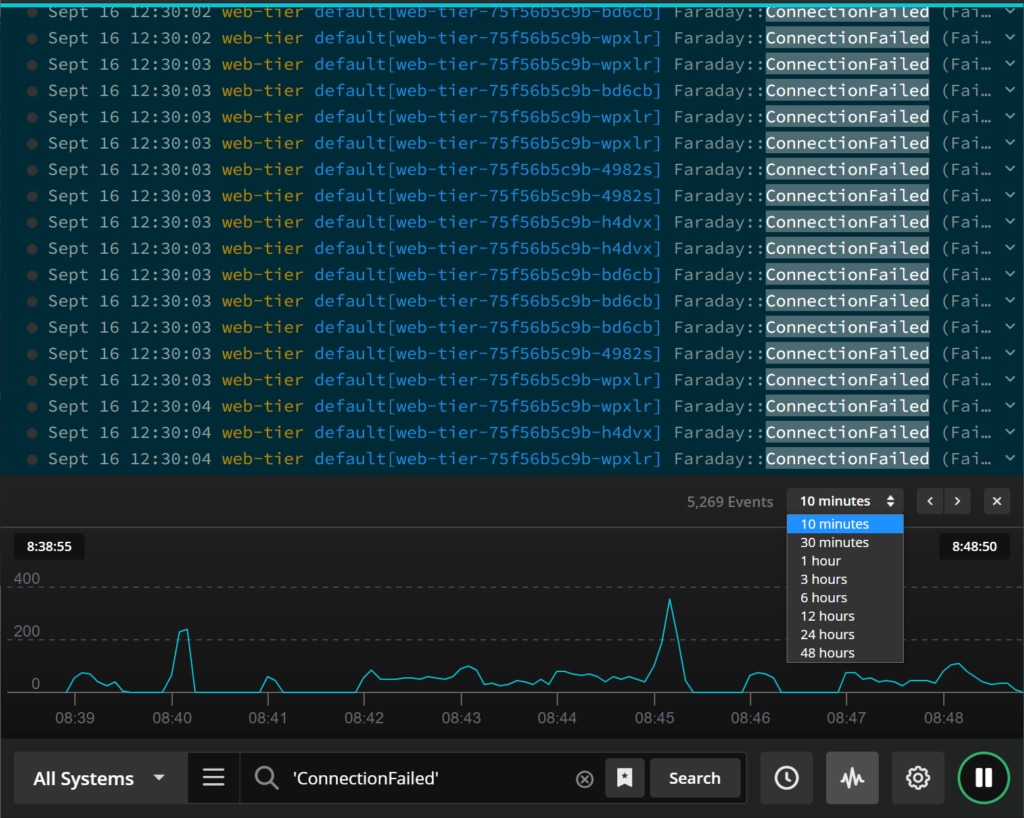
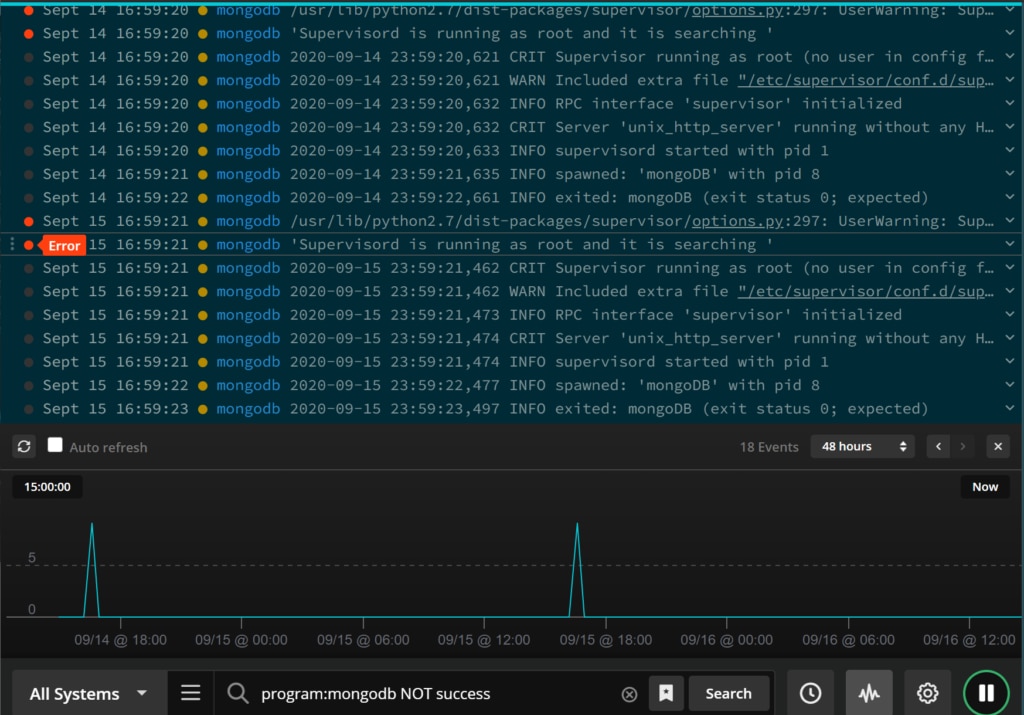
Fortunately, Papertrail has a nifty Log Velocity view designed to let you visually explore event message volume changes right in the event viewer. The graph charts out the event volume minute by minute, which is great for visualizing the normal event throughput. The visualization also lets you focus on the event messages more likely to pertain to the incident you’re investigating without scanning through screens and screens of events.
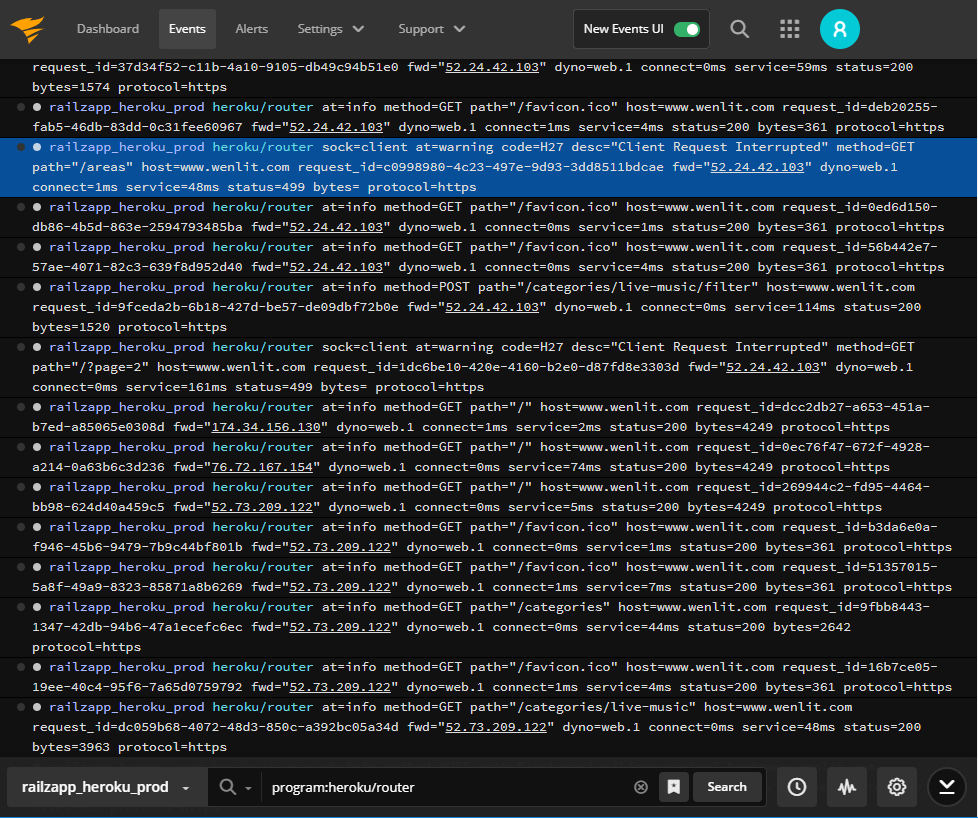
To use the Log Velocity graph, select the graph icon to the right of the search bar. The log velocity graph appears above the search bar and displays the log throughput for the current search.
You can use the time selector to look at event message volumes for the current search in the past 10 minutes or as far back as 48 hours. If you spot spikes or lulls in the event volume, you can select a point on the graph and load the events for the selected search and time frame.
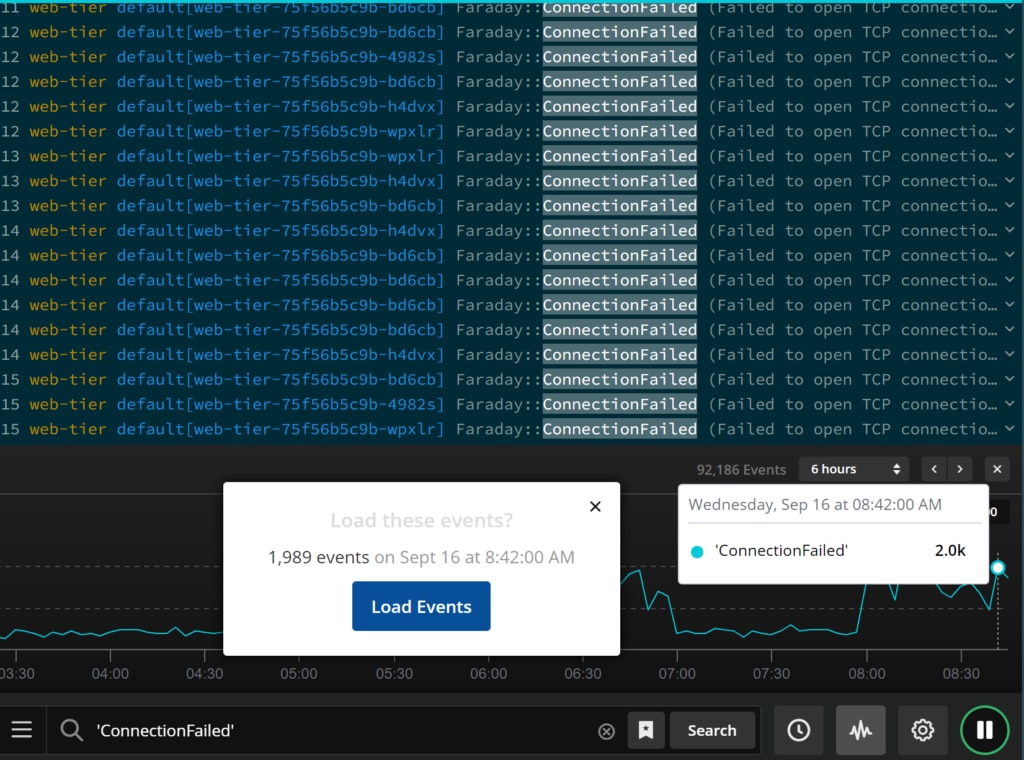
Starting with the visualization of the event message flow, finding spikes or lulls in event volume, and loading the event messages at that time can be a great time-saver when you aren’t sure where to focus your troubleshooting efforts.
Searching by Eliminating Normal Events
Even after you’ve narrowed your event search to the events around a spike or lull in event message volume, you could still be faced with multiple screens packed with events. Seeing patterns or spotting outliers in row after row of events remains challenging. This is where the second strategy comes in: eliminating “normal” events so unusual events become easier to spot.
The general idea is to start with a set of event messages (those just before a spike in event volumes, for example) and methodically eliminate messages you know are normal. To eliminate event messages in Papertrail, you simply add “-” or “NOT” before a system name, log level, or message text in the search bar to remove events matching the criteria from the search results. You can continue to weed out normal event messages by stringing the dashes and NOTs in the search bar.
Within a few minutes, you’ll be able to narrow down the search results. With any luck, you’ll be able to spot anomalies and find the underlying issue.
In addition to finding these unknown events, you may stumble across other problems you didn’t even know you had. Though these other problems may not be causing an issue right now, identifying and addressing them could prevent issues going forward.
Next Steps
There’s even more you can do in the Papertrail event viewer to optimize your event searches. To get all the details and explore other searching options, check out the knowledge base article .
If you haven’t yet, try out the new event viewer and log velocity analytics and let us know what you think.