Make Your Logs Work for You

The days of logging in to servers and manually viewing log files are over. SolarWinds® Papertrail™ aggregates logs from applications, devices, and platforms to a central location.

View Technology Info

FEATURED TECHNOLOGY

Troubleshoot Fast and Enjoy It

SolarWinds® Papertrail™ provides cloud-based log management that seamlessly aggregates logs from applications, servers, network devices, services, platforms, and much more.

View Capabilities Info

FEATURED CAPABILITIES

Aggregate and Search Any Log

SolarWinds® Papertrail™ provides lightning-fast search, live tail, flexible system groups, team-wide access, and integration with popular communications platforms like PagerDuty and Slack to help you quickly track down customer problems, debug app requests, or troubleshoot slow database queries.

View Languages Info

FEATURED LANGUAGES

TBD - APM Integration Title

TBD - APM Integration Description

TBD Link

APM Integration Feature List

TBD - Built for Collaboration Title

TBD - Built for Collaboration Description

TBD Link

Built for Collaboration Feature List

Blog > At-a-glance sender log data transfer visibility

At-a-glance sender log data transfer visibility

Posted by By telliott on June 20, 2013

We just made identifying high-volume senders easier. Now when you view information about a group, you’ll see a pie chart of currently-searchable log messages broken down by sender.

Here’s an example (credit: @lmarburger):

image

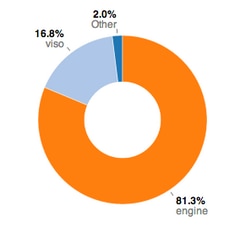
In this example, 81% of currently-searchable log messages were generated by a sender called engine.

When to use it

When one sender generates a flood of logs, or you’re curious which senders are unusually verbose, this is the place to start.

Combine with Papertrail’s free log filtering, verbosity tips, and minimum alert thresholds to establish and act on the log velocity that’s best for you. We’ll continue to add ways to see and control velocity.

How to use it

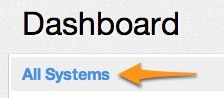
To see a chart, visit the Dashboard and click the name of any group, such as “All Systems”:

image

Here’s the chart code (JavaScript). Thanks to Stephen Boak for creating the pie chart.

Enjoy!