Real-time GC log analysis
-
Centralize all your GC logs
Aggregate all GC logs into a central place and create an infrastructure-wide view of your data. -
Speed up diagnosis and resolution
Quickly find the information you need in your GC logs to resolve issues. -
Visualize your data
Detect trends and patterns sooner by creating an interactive visualization.
Here's how SolarWinds Papertrail helps
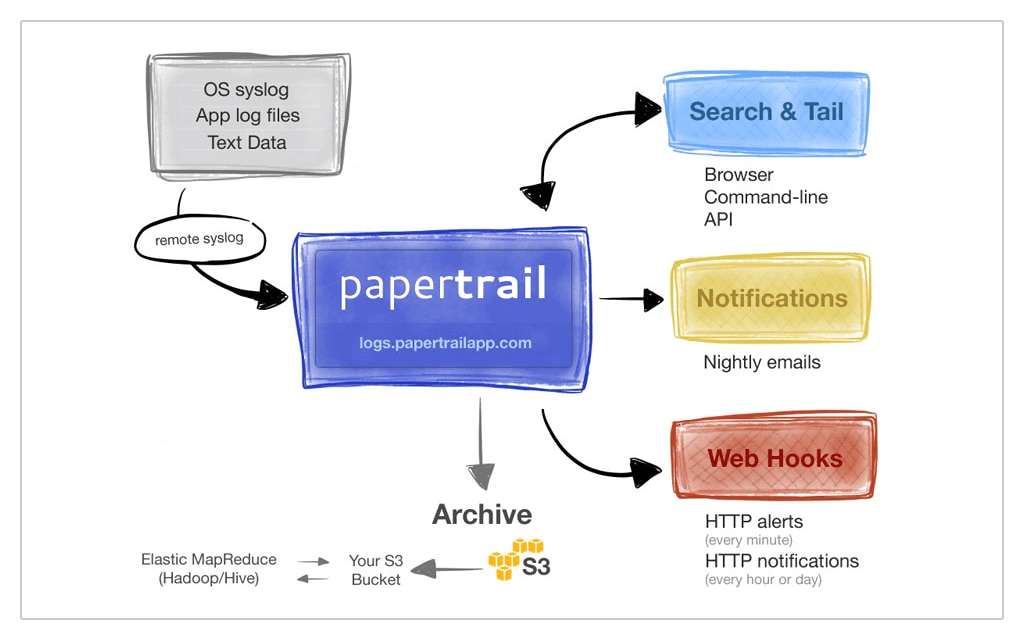
Consolidate all your GC logs
To get a clear picture of your apps' and services' behavior and performance, you need to aggregate all GC logs into a single place. With SolarWinds Papertrail, you can build a holistic view to make analysis and troubleshooting simpler and faster.
● Send logs to Papertrail via the syslog protocol using various libraries and frameworks for your programming language and runtime.
● Alternatively, the simple standalone remote_syslog2 daemon can monitor plain-text files and forward new messages to SolarWinds Papertrail.
● Transmit logs over UDP or TCP with TLS encryption for improved security and protection.
All your logs are automatically parsed thanks to the support Papertrail provides for various log formats. Because logs are stored in the cloud, you can store as much data as you need without worrying about exhausting your storage capacity.
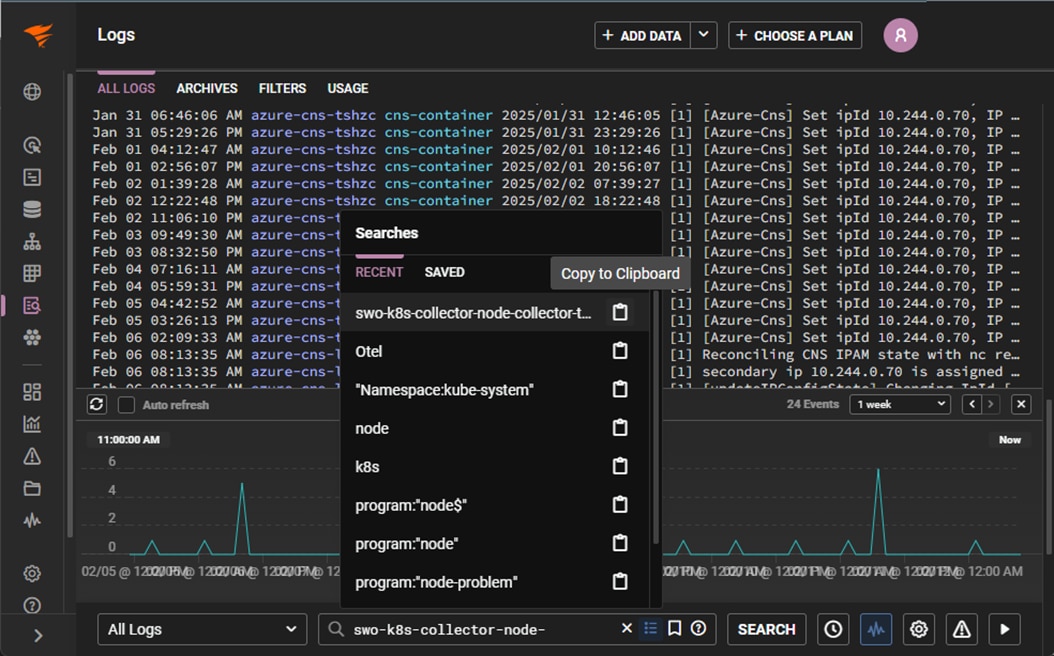
Speed up diagnosis and resolution
With all your GC logs in one place, you need a simple way to cut through the noise and focus on the messages you need. The simple-search syntax of SolarWinds Papertrail supports full-string searches along with Boolean operators for trimming down huge log volumes.
● Create filters to isolate log messages based on origin, time, or custom fields.
● Need a more powerful way to select your results? Use regular expressions to craft custom filters regardless of where the critical information is located in your log messages.
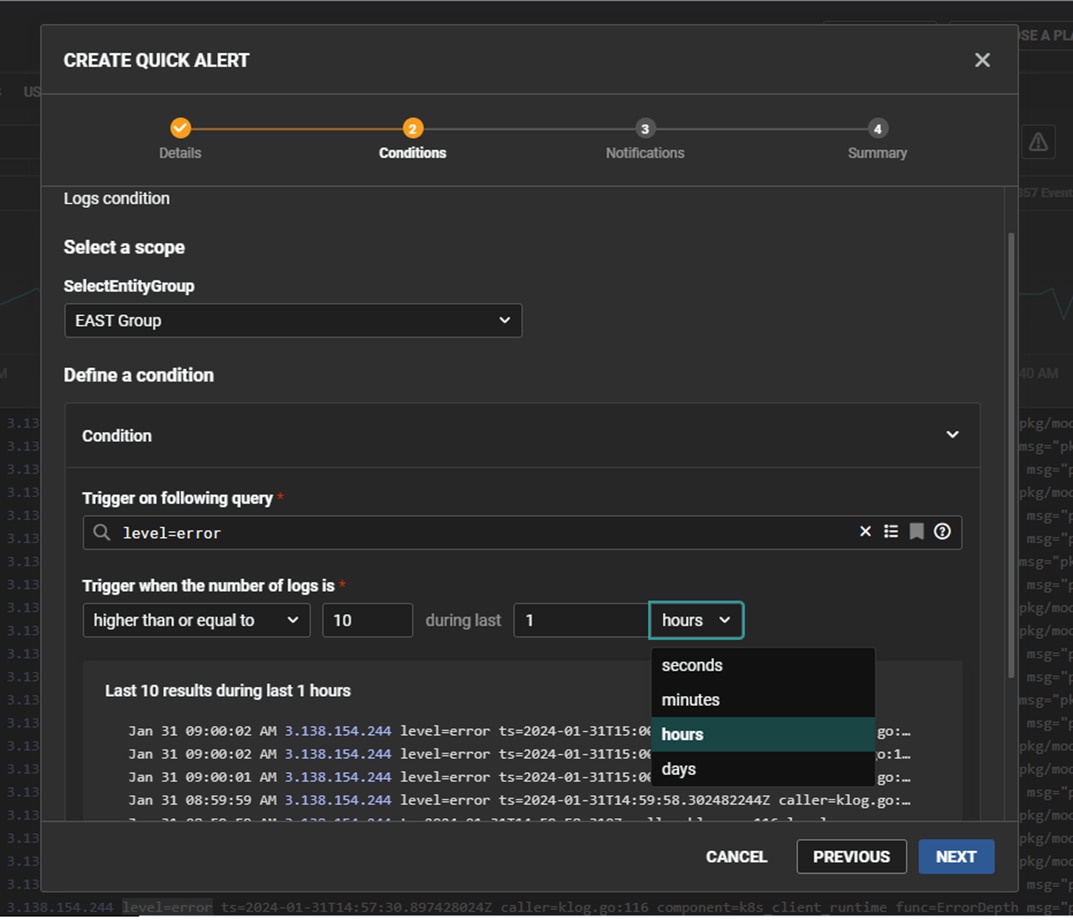
● Turn searches into alerts by saving them and assigning a schedule. Then, get notified about problems before they become major incidents.
● Create custom monitors to watch critical metrics (such as GC compaction latency above a threshold) and provide daily summaries of interesting stats.
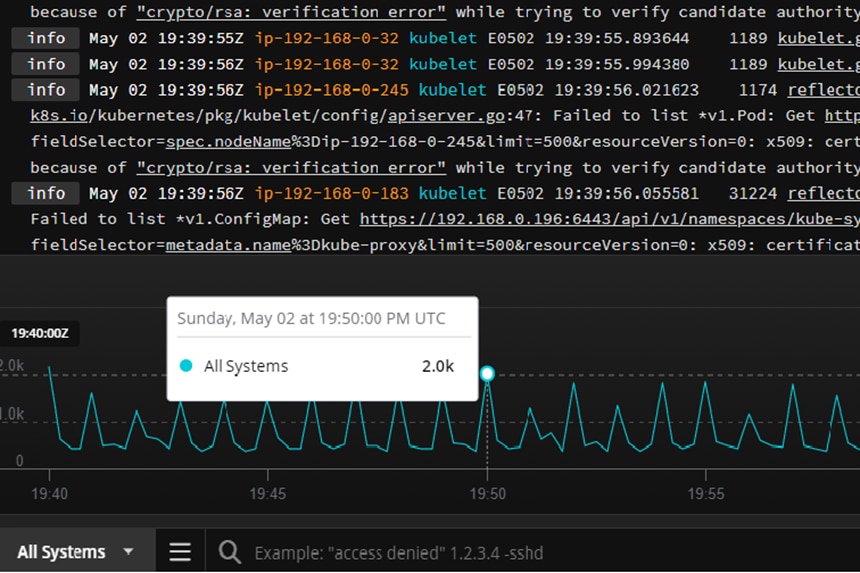
Visualize your data
Sometimes it’s difficult to see the forest for the trees. The SolarWinds Papertrail log velocity analytics view enables you to transform your data into an interactive visualization, making it easy to switch quickly from a high-level view to detailed event information.
● Easily identify patterns and anomalies by visualizing historical data.
● Scroll forward and backward to see how patterns in your data change over time.
● Need to drill down into the details? Simply click on the interactive charts to focus on specific events from the selected time period.
Visualizing data from the past few weeks allows you to see where GC latency spikes have occurred and makes it easier to identify performance degradation before your users notice.
- GC Log Analyzer
- Aggregate, monitor, and analyze all your logs in one place. Get the most out of your Java GC logs with our cloud-based log analysis solution.Looking for something more advanced? Check out the SolarWinds event log analyzer tool